


US Dollar, USD/SGD, USD/IDR, USD/THB, USD/TWD – ASEAN Technical Analysis
- US Dollar remains under pressure against ASEAN currencies
- USD/SGD downside momentum is fading, USD/IDR ranging
- USD/THB and USD/TWD are pressuring key support levels
Singapore Dollar Technical Outlook
The Singapore Dollar is looking to resume its advance against the US Dollar since late March as USD/SGD inches closer towards lows from 2018. There was a brief bounce off the midpoint of the Fibonacci extension at 1.3242 which also closely aligned with a falling support line from June – see daily chart below. Positive RSI divergence does show that downside momentum is fading which can at times precede a turn higher. However, the 20-day and 50-day Simple Moving Averages (SMAs) can maintain the focus to the downside in such an outcome as key resistance points. Otherwise,

USD/SGD Daily Chart
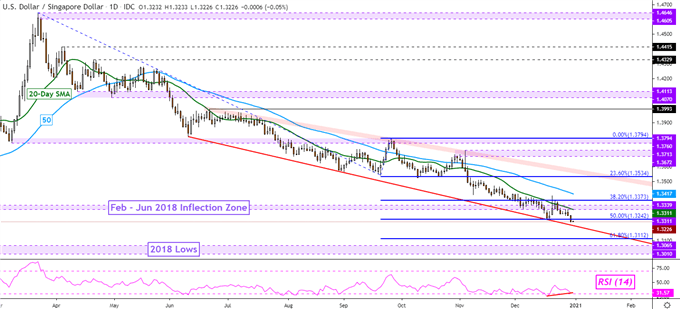
USD/SGD Chart Created in TradingView
Indonesian Rupiah Technical Outlook
The Indonesian Rupiah continues to consolidate against the US Dollar at levels just above lows USD/IDR set back in June. Prices recently turned lower after testing the 50-day SMA, placing the focus on the 13935 – 14012 support zone. A push under the latter exposes the January 2020 low at 13560. Otherwise, a climb through the moving average places the focus on the 14525 – 14563 inflection zone on the way towards highs from August through September. The latter make for an area of resistance between 14915 and 14975.
For updates on ASEAN currencies as they break key technical levels, be sure to follow me on Twitter @ddubrovskyFX.
USD/IDR Daily Chart
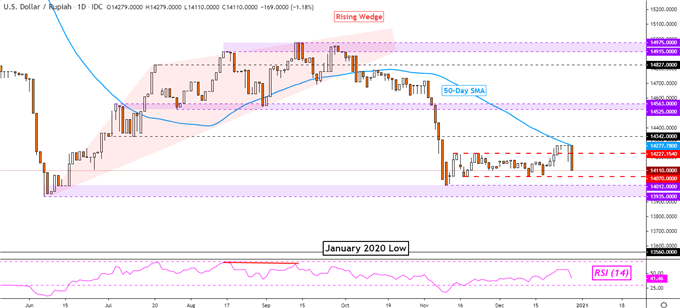
USD/IDR Chart Created in TradingView
Thai Baht Technical Outlook
Thailand’s Baht also continues to consolidate against the US Dollar after USD/THB bounced off the December 31st, 2019 low at 29.72. This followed positive RSI divergence, hinting of a turn higher as expected. The 20-day SMA has been maintaining the focus to the downside however as prices attempt to fall back to 29.72. A push above the 20-day SMA will expose the 50-day one. Former support at 30.74 may hold as new resistance in the event of a material turn higher. Otherwise, a drop through the 2019 low exposes the trough set in 2013.

USD/THB Daily Chart
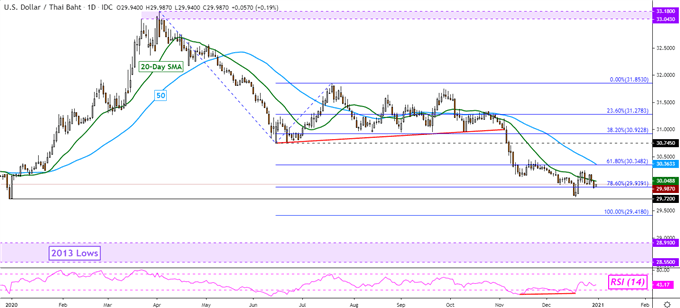
USD/THB Chart Created in TradingView
New Taiwan Dollar Technical Outlook
The New Taiwan Dollar is pressuring key support against the US Dollar, with USD/TWD eyeing the 78.6% Fibonacci extension at 27.98. The 20-day and 50-day SMAs continue to keep the focus towards the downside, particularly after the pair fell to its lowest in over 30 years. A fall through support exposes the 100% Fibonacci extension at 27.60 followed by lows set in 1996 and 1997. The latter could make for a critical support zone between 27.15 and 27.34.
USD/TWD Daily Chart
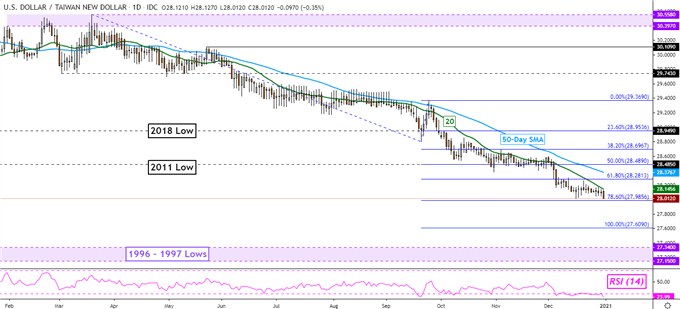
USD/TWD Chart Created in TradingView
--- Written by Daniel Dubrovsky, Currency Analyst for DailyFX.com
To contact Daniel, use the comments section below or @ddubrovskyFX on Twitter


