


US Dollar, USD/SGD, USD/IDR, USD/PHP, USD/THB – ASEAN Technical Analysis
- US Dollar continues to lose ground against the Singapore Dollar
- USD/IDR, USD/PHP idling above key support levels for direction
- USD/THB eyes 2019 lows after Treasury adds Thailand to key list
Singapore Dollar Technical Outlook
The Singapore Dollar extended gains against the US Dollar, pushing USD/SGD under the 2018 inflection zone on the daily chart below. That has opened the door to prolonging the dominant downtrend since late March. This follows the Fed rate decision that inspired broad weakness in the Greenback. Now, the pair is facing its next key technical test as falling support from June crosses with the midpoint of the Fibonacci extension at 1.3242. A bounce would place the focus on the 20-day Simple Moving Average for resistance. Otherwise, the pair may continue inching towards 2018 lows.

USD/SGD Daily Chart
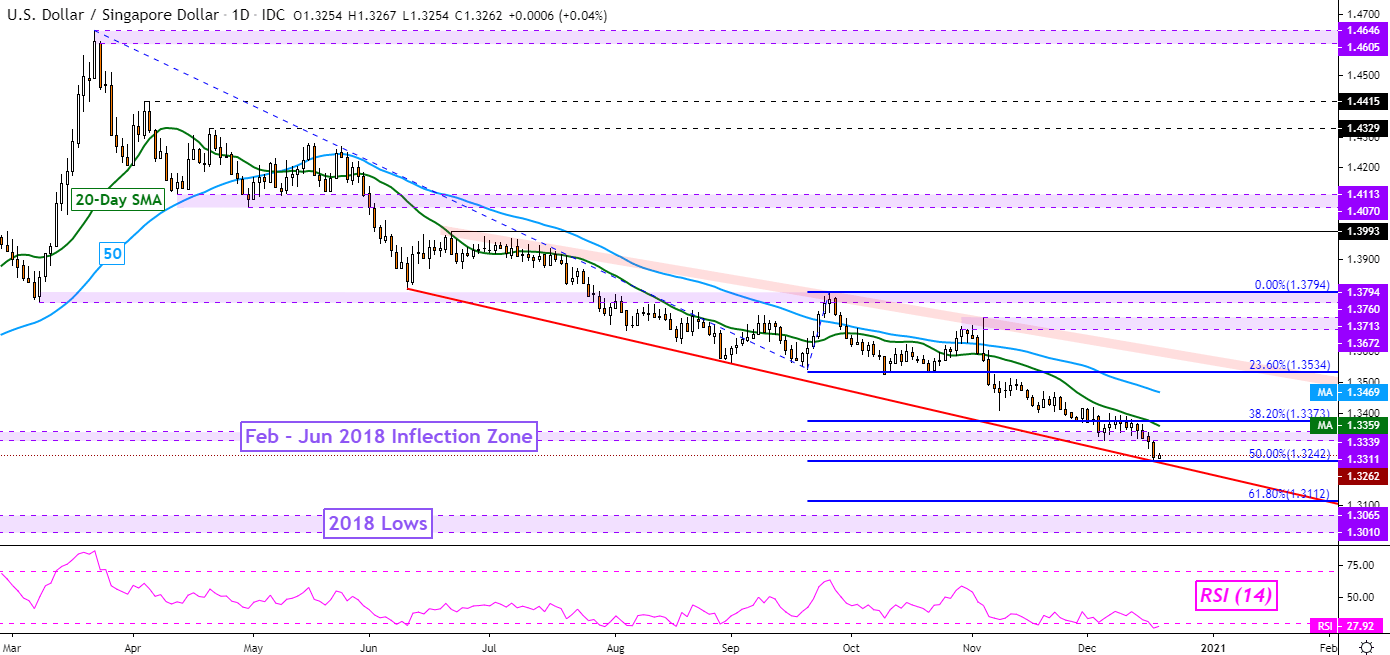
USD/SGD Chart Created in TradingView
Indonesian Rupiah Technical Outlook
After the Bank of Indonesia left benchmark lending rates unchanged, the Rupiah continued consolidating against the US Dollar. The central bank strengthened measures to stabilize its currency to keep it from weakening too much.
USD/IDR is trading within a short-term horizontal channel where support sits between 14012 and 14070. Resistance appears at 14227, with the 50-day SMA slowly closing in. Resuming losses since September entails pushing under lows from June, which would expose the January 2020 low. Otherwise, the SMA may keep the focus tilted to the downside in the event of a turn higher.
For updates on ASEAN currencies as they break key technical levels, be sure to follow me on Twitter @ddubrovskyFX.
USD/IDR Daily Chart

USD/IDR Chart Created in TradingView
Philippine Peso Technical Outlook
The Philippine Peso continues to idle around its strongest against the US Dollar in over 4 years. BSP Chief Benjamin Diokno doesn’t seem to be concerned about the impressive gains PHP has seen this year, anticipating gradual gains as the economy reopens.
USD/PHP has slowed its downside progress since late November after taking out the 48.28 – 48.36 support zone. The October 2016 low sits immediately below as key support at 47.92. Taking out the price exposes an inflection zone from earlier in the same year – see chart below. Keep a close eye on RSI, which could show signs of fading downside momentum in the form of positive divergence.

USD/PHP Daily Chart
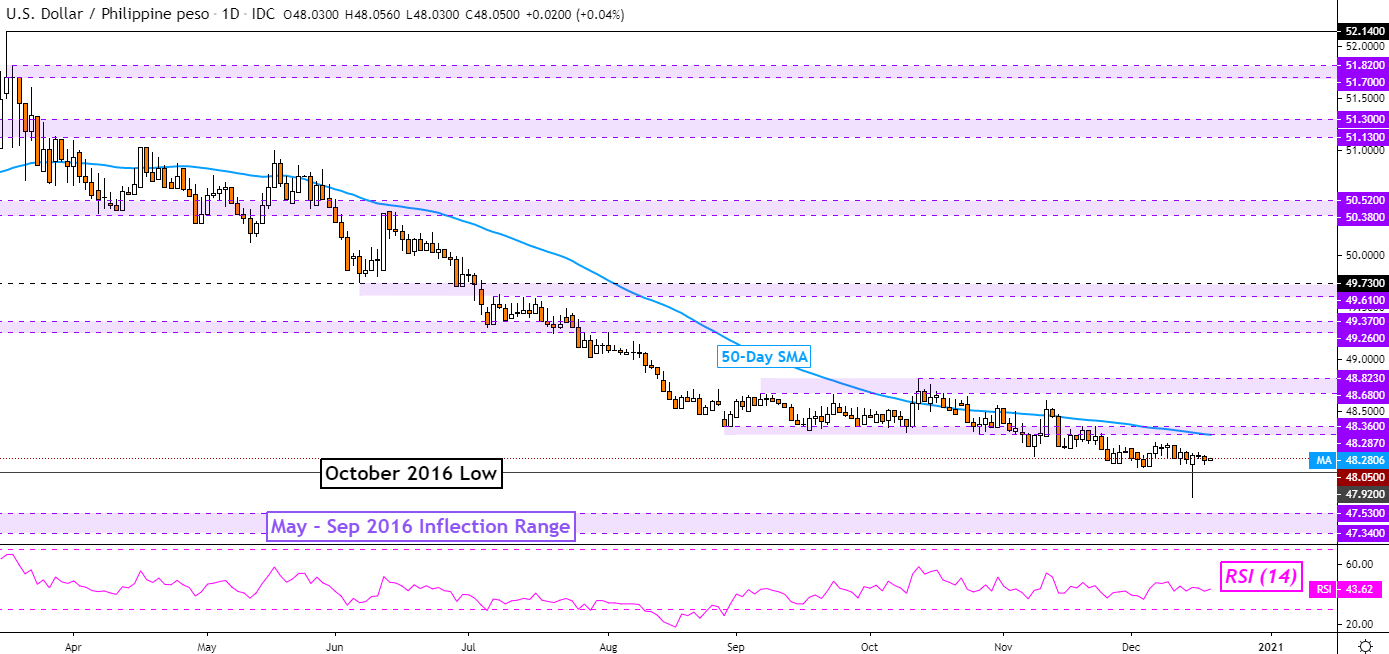
USD/PHP Chart Created in TradingView
Thai Baht Technical Outlook
Thailand’s Baht extended gains against the US Dollar in recent days, likely to the displeasure of the nation’s central bank. Earlier in December, the Bank of Thailand said that it would take steps to slow the currency’s gain, being concerned about its impact on the economy. However, after the US Treasury added Thailand to its monitoring list for currency manipulation, fading prospects of intervention may have induced recent gains.
Now, USD/THB is hovering above the 2019 low at 29.72 with positive RSI divergence showing that downside momentum is fading. This can at times precede a turn higher and could place the focus on the 20-day SMA for resistance. Otherwise, further losses expose the 100% Fibonacci extension at 29.418 as lows from 2013 would be exposed.
USD/THB Daily Chart
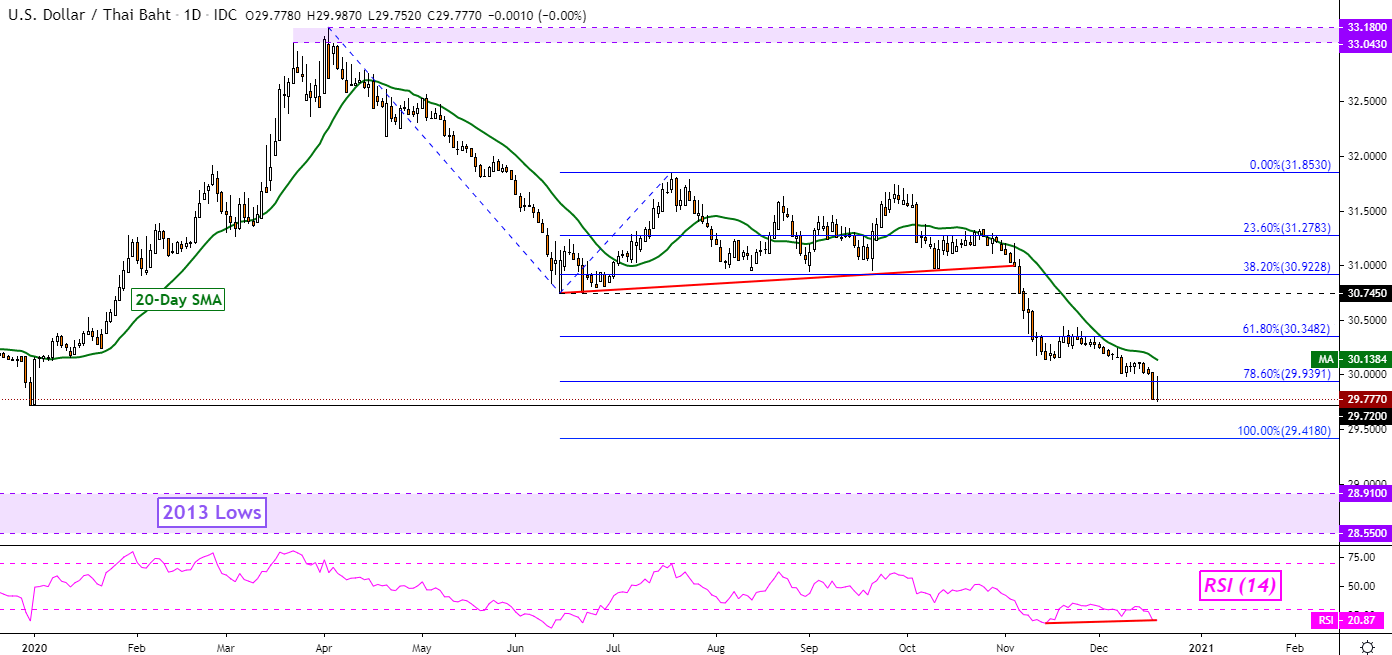
USD/THB Chart Created in TradingView
--- Written by Daniel Dubrovsky, Currency Analyst for DailyFX.com
To contact Daniel, use the comments section below or @ddubrovskyFX on Twitter
https://www.tradingview.com/symbols/USDTHB/?exchange=FX_IDC


