


Canadian Dollar, USD/CAD, AUD/CAD, NZD/CAD, CAD/JPY – Technical Analysis
- USD/CAD attempting to push above short-term falling resistance
- AUD/CAD technical view bearish, NZD/CAD eyes inflection point
- CAD/JPY may breakout lower but bigger picture remains neutral
USD/CAD Technical Outlook
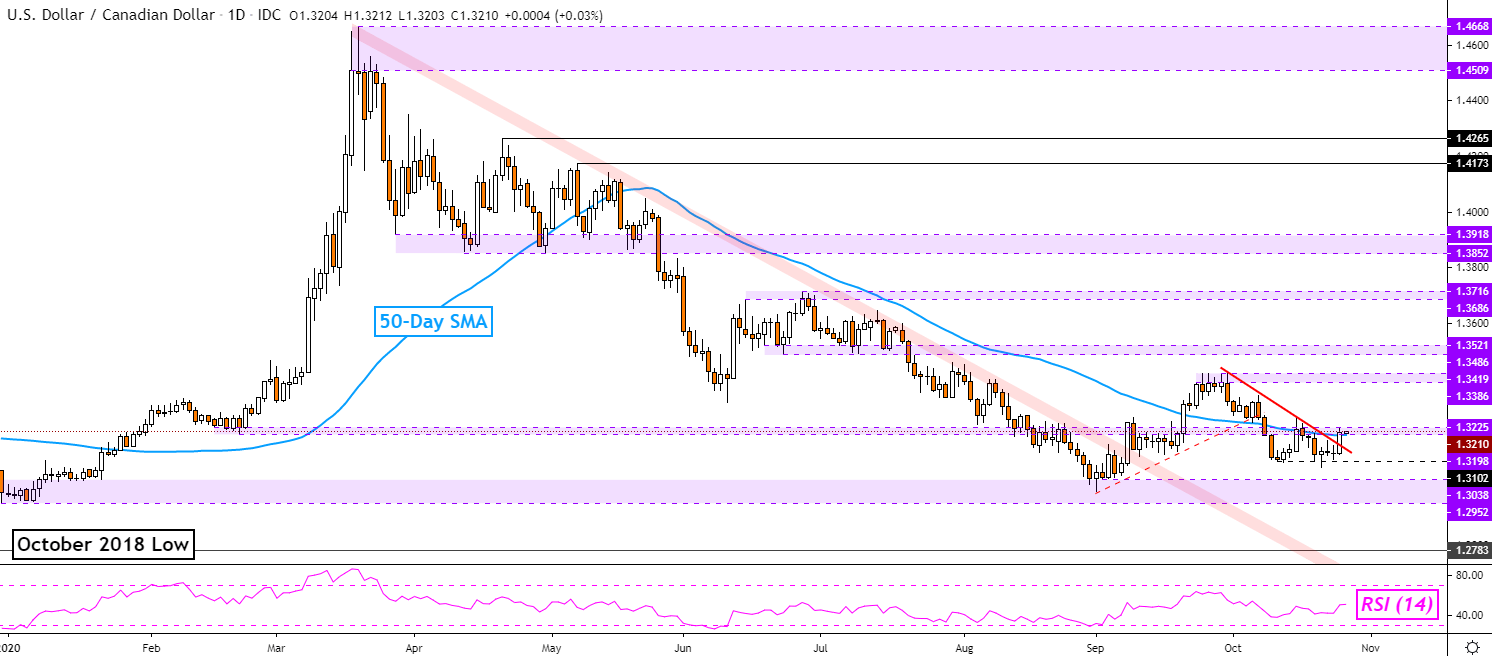
USD/CAD is attempting to break above short-term descending resistance from late September. However, prices are caught in the 1.3198 – 1.3225 inflection zone as well as the 50-day Simple Moving Average (SMA). As such, a breakout above these technical barriers could reinforce prospects of the pair retesting September highs. Otherwise, the Canadian Dollar could appreciate towards 2020 lows against the US Dollar.
| Change in | Longs | Shorts | OI |
| Daily | -2% | 7% | 5% |
| Weekly | -30% | 38% | 13% |
USD/CAD - Daily Chart
AUD/CAD Technical Outlook
The AUD/CAD technical outlook remains cautiously tilted to the downside after a ‘Death Cross’ – see below. That is when a short-term SMA (20-day) crosses under a medium-term one (50-day). The pair is retesting the 0.9396 – 0.9445 inflection zone after establishing support at 0.9251. If this zone, as well as the moving averages, hold ahead, AUD/CAD could fall back towards support. Otherwise, 2020 highs will be exposed.
AUD/CAD - Daily Chart

NZD/CAD Technical Outlook
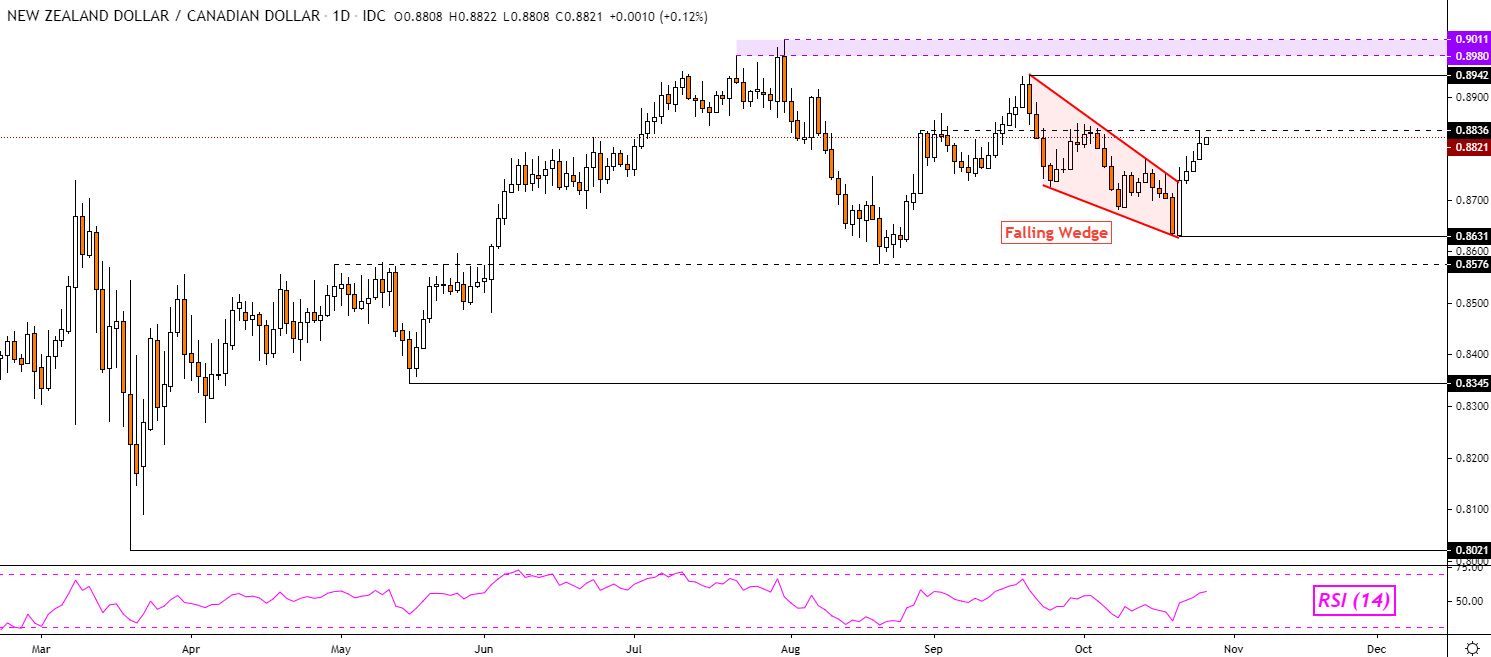
NZD/CAD may extend gains after confirming a breakout above a bullish Falling Wedge chart pattern. However, prices may get caught up when testing the 0.8836 inflection point established back in August. If this price holds, the pair may turn lower back towards support at 0.8631. Otherwise, a push above resistance exposes the September high on the way towards current 2020 peaks.

NZD/CAD - Daily Chart
CAD/JPY Technical Outlook
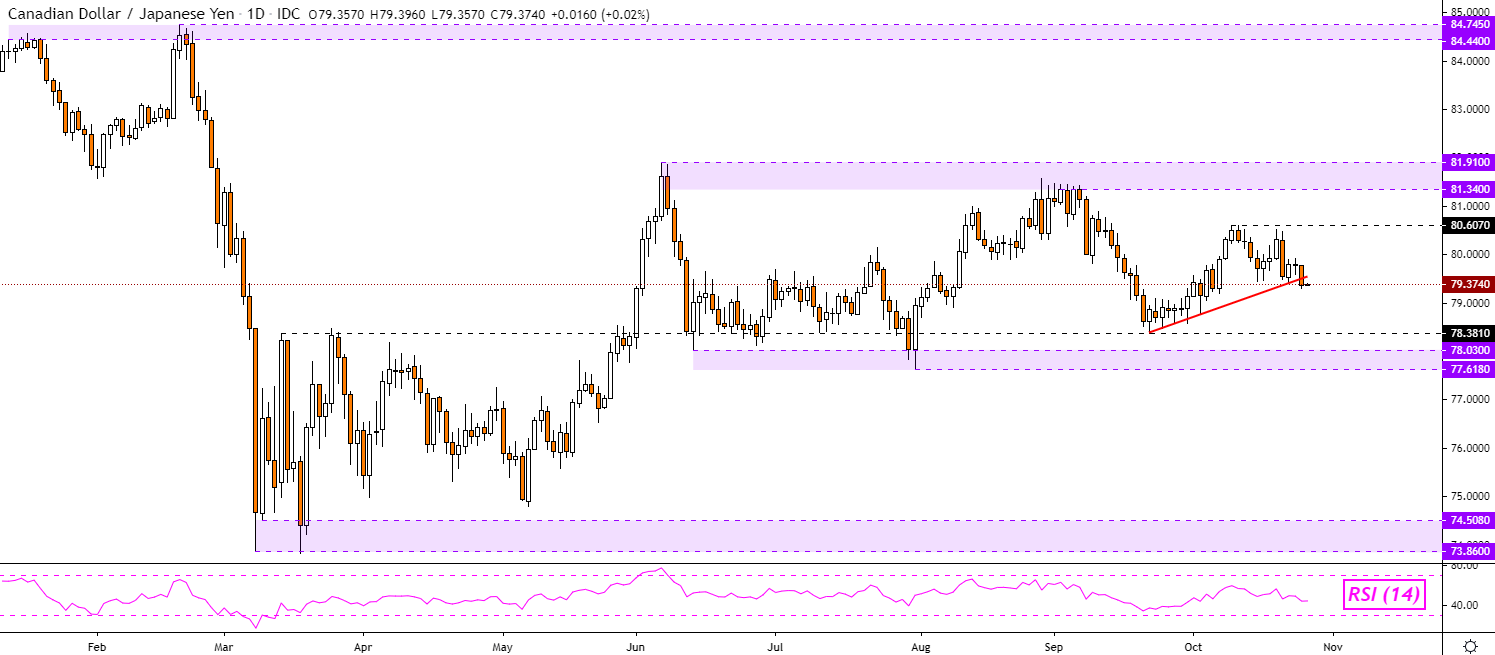
CAD/JPY appears to be attempting to break under short-term rising support from September. A confirmatory downside close could place the focus on the 78.38 inflection zone. Otherwise, key resistance sits above at 80.607. In the bigger picture however, the pair could remain in a consolidative state. Prices have been oscillating between support (77.61 – 78.03) and resistance (81.91 – 81.34) since May.
CAD/JPY - Daily Chart
--- Written by Daniel Dubrovsky, Currency Analyst for DailyFX.com
To contact Daniel, use the comments section below or @ddubrovskyFX on Twitter


