British Pound, GBP/USD, GBP/CAD, GBP/NZD, GBP/CHF - Technical Forecast
- GBP/USD could be at risk to extending recent losses
- GBP/CAD & GBP/NZD may bounce on key support
- GBP/CHF faces bearish risk post triangle breakout
GBP/USD Technical Analysis
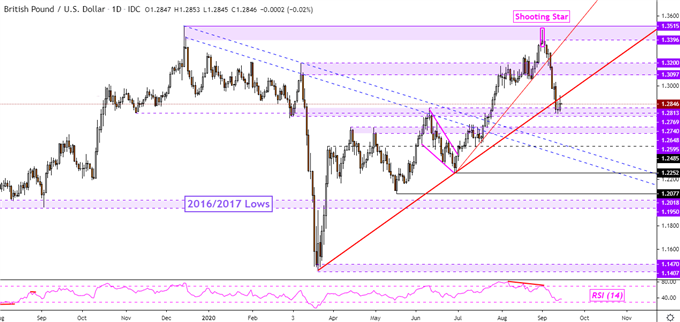
The British Pound could be at risk to further losses against the US Dollar. On the daily chart below, GBP/USD has broken under key rising support from March. This followed the emergence of a Shooting Star candlestick pattern, preceding the top just under December 2019 highs. Follow-through under the trend line has been somewhat lacking as key support held between 1.2740 and 1.2813. A daily close under the latter could open the door to extending losses.
GBP/USD – Daily Chart

GBP/CAD Technical Outlook
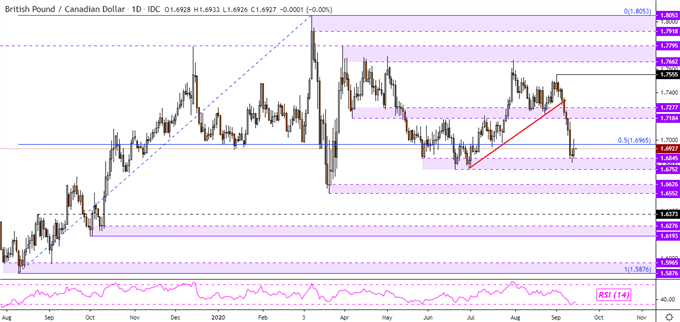
The British Pound could gain ground against the Canadian Dollar despite recent declines in GBP/CAD. After falling under a near-term rising trend line, the pair paused its descent just above the 1.6752 – 1.6845 support zone. A daily close above the midpoint of the Fibonacci retracement at 1.6965 could open the door to a turn higher. Otherwise, a drop through support exposes lows from March between 1.6552 and 1.6626.


GBP/CAD- Daily Chart

GBP/NZD Technical Outlook
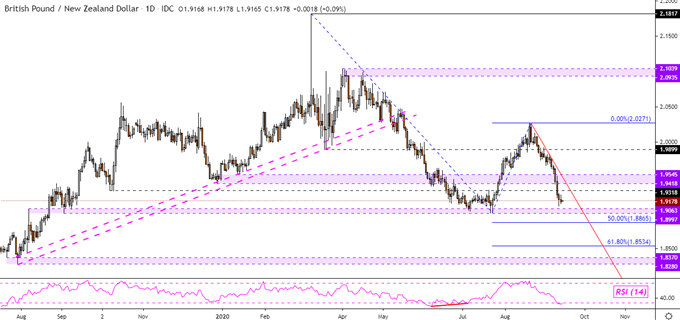
Against the New Zealand Dollar, the British Pound is fast approaching the 1.8997 – 1.9063 inflection range. This follows a top at 2.027, resuming the dominant downtrend from earlier this year. A bounce ahead would place the focus for GBP/NZD on falling resistance from August. Otherwise, a drop through the inflection range exposes the midpoint and 61.8% Fibonacci extension levels at 1.8865 and 1.8534 respectively.
Follow me on Twitter @ddubrovskyFX for updates on the British Pound and other asset classes!
GBP/NZD – Daily Chart

GBP/CHF Technical Outlook
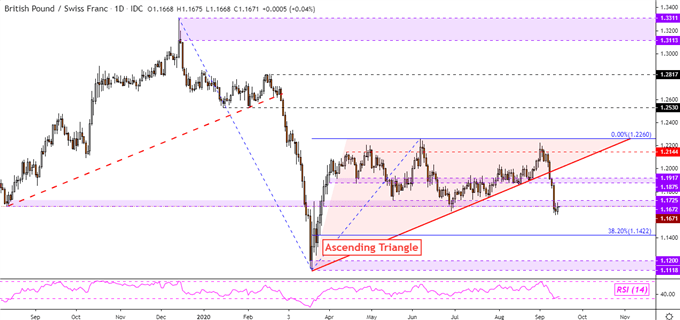
The British Pound seems vulnerable against the Swiss Franc after GBP/CHF confirmed a downside breakout through an Ascending Triangle continuation pattern. This could eventually pave the way for the pair to revisit the current 2020 low at 1.1118. The recent break under the 1.1672 – 1.1725 inflection zone underscores this argument. Getting to lows from March entails taking out the 38.2% Fibonacci extension at 1.1422.
GBP/CHF - Daily Chart

--- Written by Daniel Dubrovsky, Currency Analyst for DailyFX.com
To contact Daniel, use the comments section below or @ddubrovskyFX on Twitter


