


US Dollar, USD/SGD, USD/MYR, USD/PHP, USD/IDR – ASEAN Technical Analysis
- Singapore Dollar testing next key support level
- USD/MYR may extend losses in the near term
- USD/PHP could rise, USD/IDR gains at risk
Singapore Dollar Technical Outlook
The Singapore Dollar extended gains against the US Dollar after prices took out the March low, as expected. Now USD/SGD is facing its next key test at support which is the 38.2% Fibonacci extension at 1.3671. Positive RSI divergence shows that downside momentum is fading which can at times precede a turn higher. Yet, falling resistance from March could maintain the dominant downtrend in the event of a bounce from here. Otherwise, further losses expose the 1.3558 – 1.3571 inflection zone.

USD/SGD Daily Chart
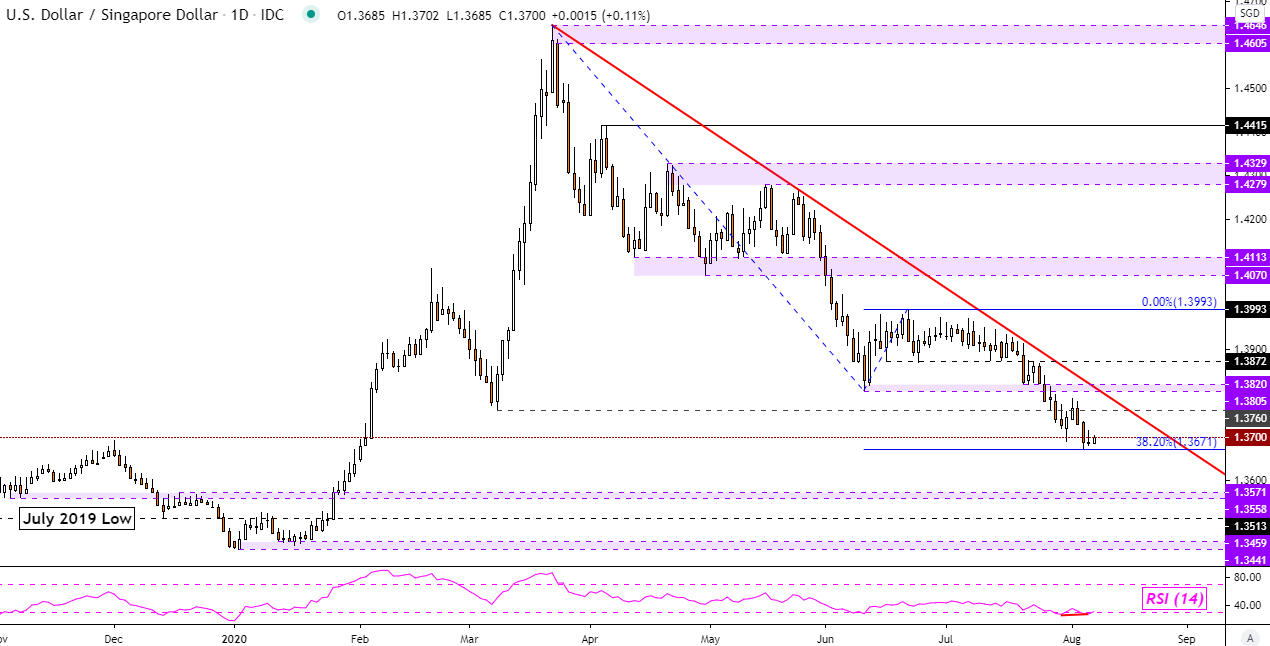
USD/SGD Chart Created in TradingView
Malaysian Ringgit Technical Outlook
The Malaysian Ringgit recently soared against the US Dollar after USD/MYR broke under a Descending Triangle continuation pattern. This has opened the door to further losses as prices test the midpoint of the Fibonacci extension at 4.1835. Just below sits the March low at 4.1600 followed by the 78.6% Fibonacci extension at 4.1226. This price closely aligns with the November 2019 low. In the event of a bounce from here, immediate resistance sits above as the 38.2% Fibonacci extension at 4.2086.

USD/MYR Daily Chart
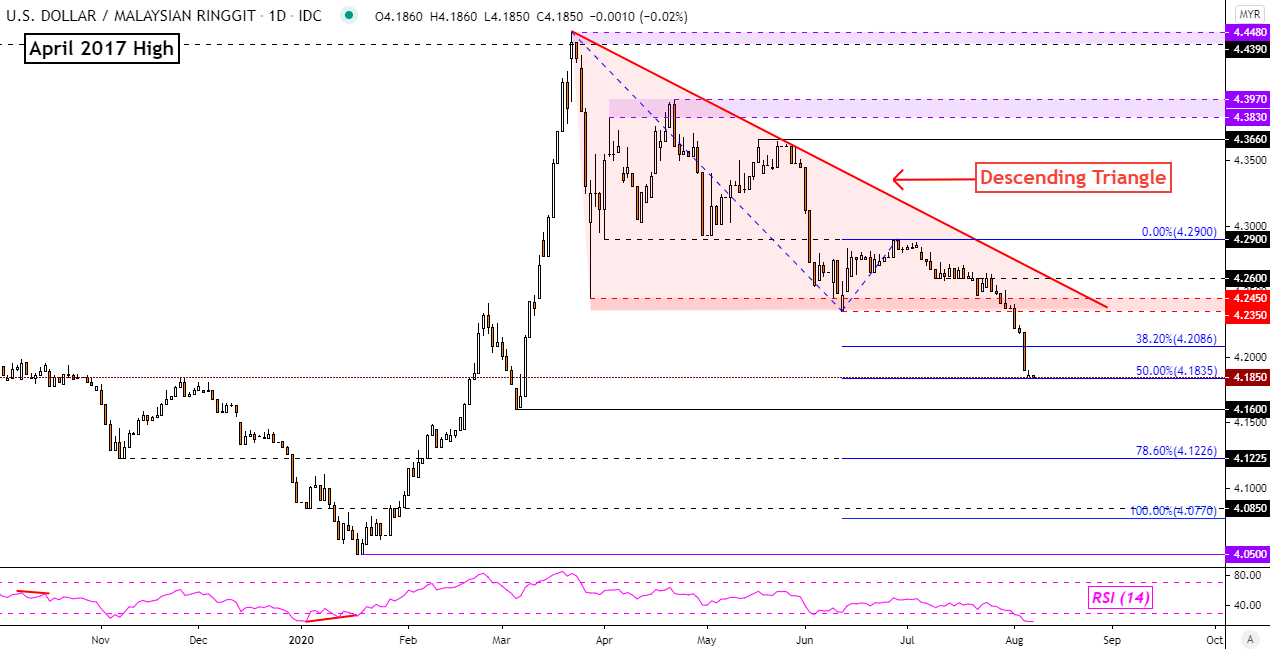
USD/MYR Chart Created in TradingView
Philippine Peso Technical Outlook
The Philippine Peso continues to trade within the boundaries of a Falling Wedge bullish reversal pattern, placing USD/PHP’s downtrend at risk. Prices seem to have established the next key support level at 49.02 where just below sits the 61.8% Fibonacci extension at 48.93. A turn higher places the focus on the 2017 floor which consists of the 49.26 – 49.37 zone. For updates on ASEAN currencies as they break key technical levels, be sure to follow me on Twitter @ddubrovskyFX.
USD/PHP Daily Chart
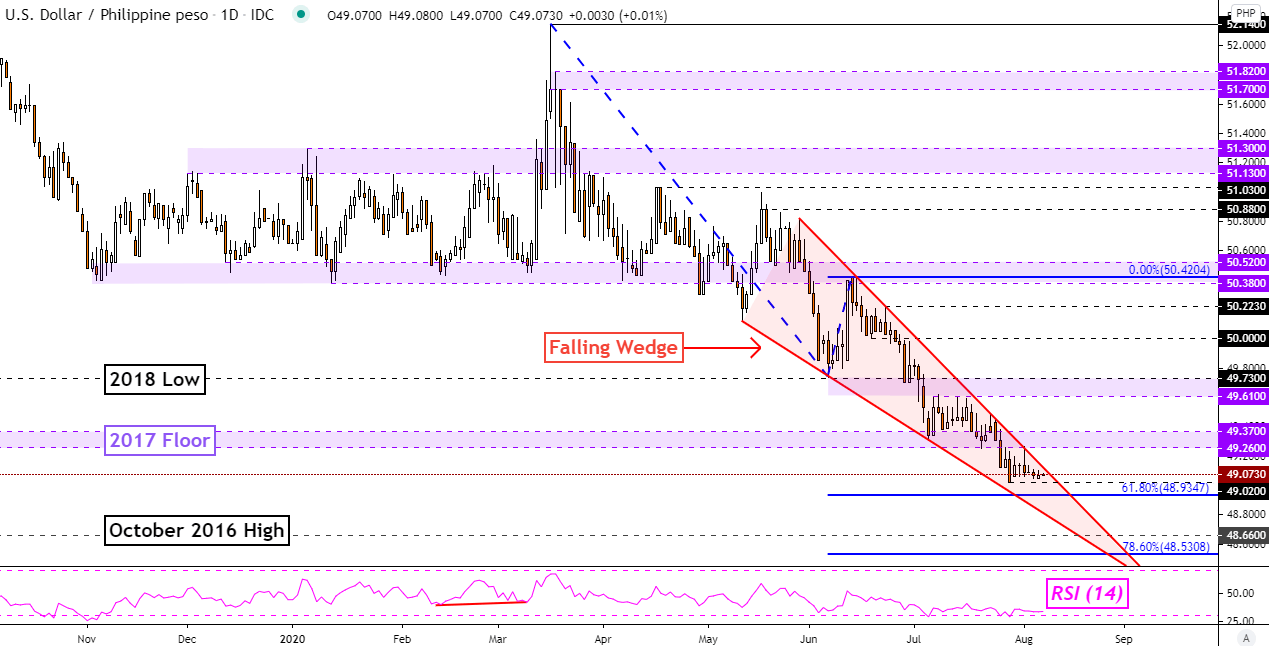
USD/PHP Chart Created in TradingView
Indonesian Rupiah Technical Outlook
The Indonesian Rupiah could be readying to reverse against the US Dollar following gains in USD/IDR since June. In July, the short-term 20-day Simple Moving Average (SMA) crossed above the medium-term 50-day SMA, forming a Golden Cross bullish technical signal. Now, USD/IDR seems to be on the verge of falling under the 20-day SMA as it targets the 50-day one. A daily close above 14710 could reinstate the focus to the upside, exposing 14827.
Find your trading personality and optimal forms of analysis
USD/IDR Daily Chart
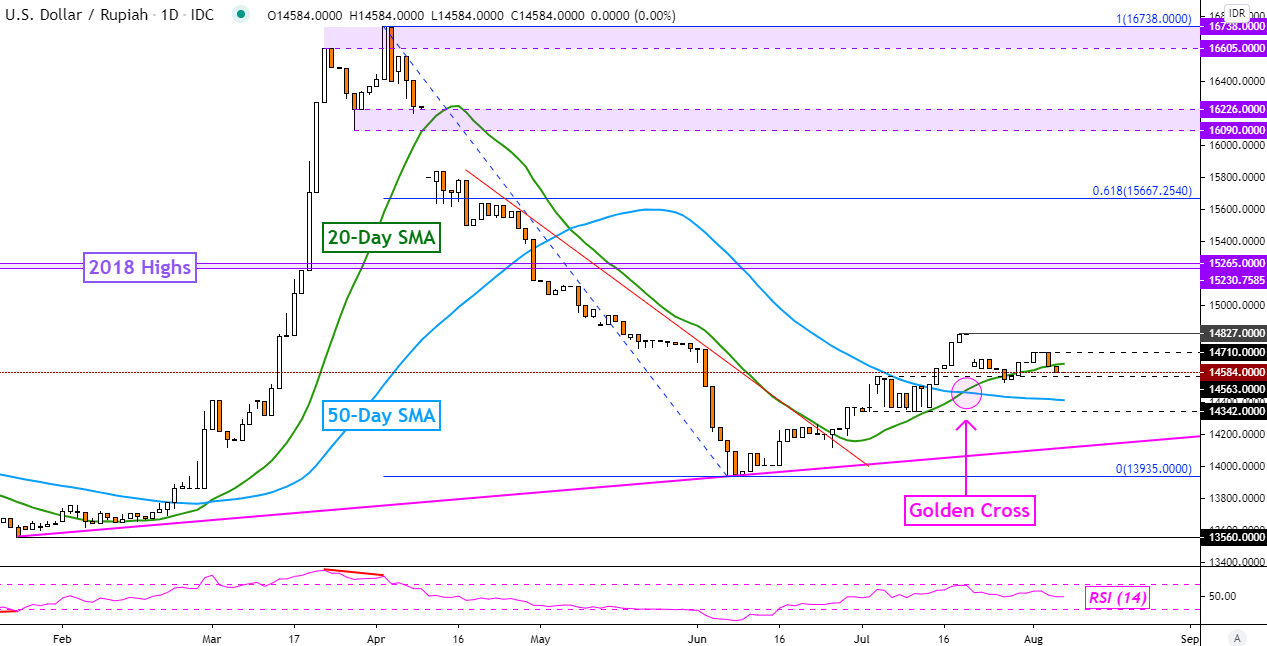
USD/IDR Chart Created in TradingView
--- Written by Daniel Dubrovsky, Currency Analyst for DailyFX.com
To contact Daniel, use the comments section below or @ddubrovskyFX on Twitter


