


US Dollar, USD/SGD, USD/MYR, USD/PHP, USD/IDR – ASEAN Technical Analysis
- Singapore Dollar may extend gains against the US Dollar
- USD/MYR at pivotal support zone within Triangle pattern
- USD/PHP could reverse higher, USD/IDR may also rise
Singapore Dollar Technical Outlook
The Singapore Dollar may extend its advance against the US Dollar after USD/SGD closed under the March low at 1.3760. This has exposed the 78.6% Fibonacci retracement at 1.3699 as immediate support. A bounce off that price may place the focus on falling resistance from late March – red line on the daily chart below. This trend line could reinstate the focus to the downside. A close under 1.3699 may pave the way to test 1.3558 which is an inflection point from November 2019.

USD/SGD Daily Chart

USD/SGD Chart Created in TradingView
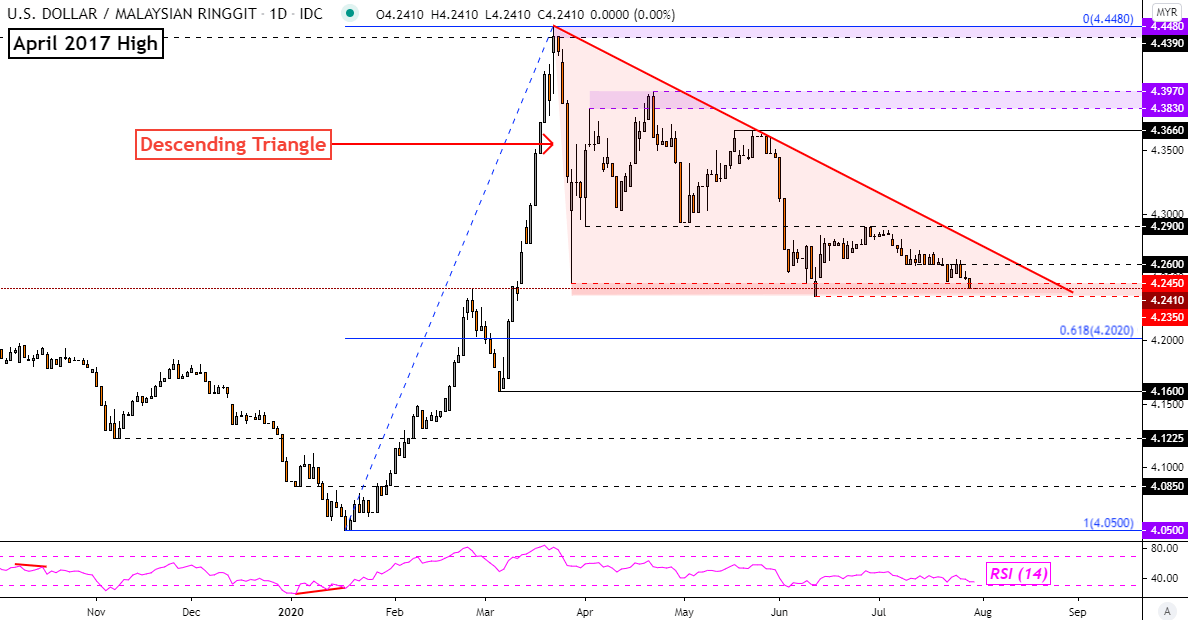
Malaysian Ringgit Technical Outlook
The Malaysian Ringgit seems to be trading within a Descending Triangle chart pattern. This is typically a continuation pattern but it can at times signify a top, or an extension of one in this case. Closing under triangle support at 4.2350 could open the door to extending the downtrend in USD/MYR since March. That would place the focus on key support at 4.2020 which is the 61.8% Fibonacci retracement. A bounce off immediate support however could result in a retest of triangle resistance, opening the door to a reversal to the upside.

USD/MYR Daily Chart
USD/MYR Chart Created in TradingView
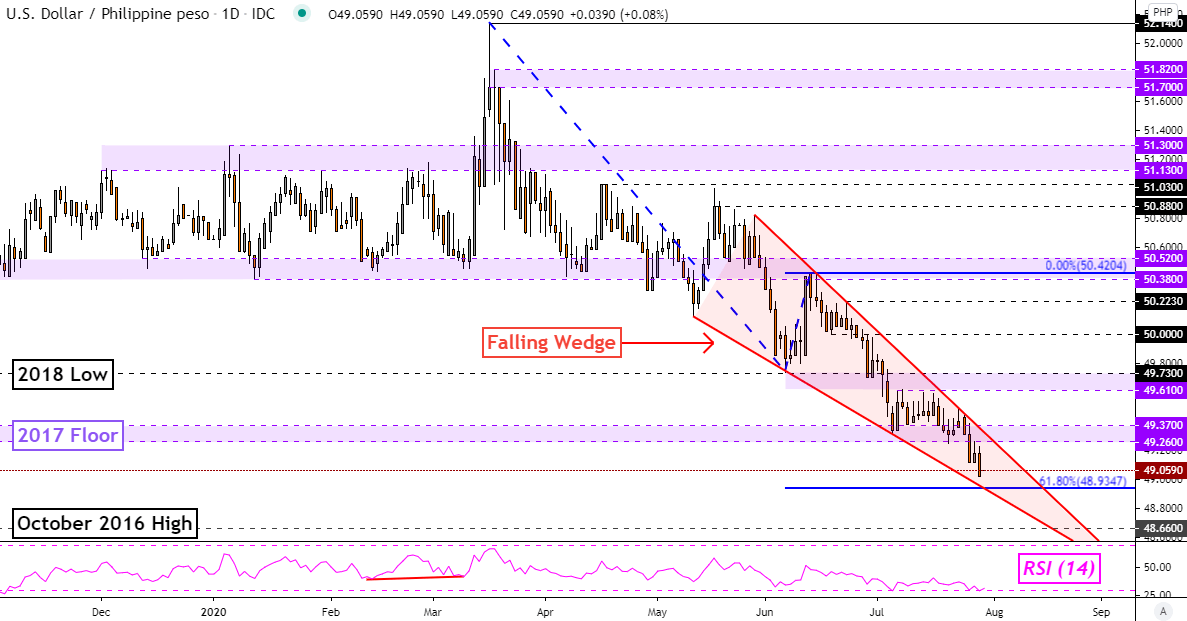
Philippine Peso Technical Outlook
The Philippine Peso may be at risk to the US Dollar with USD/PHP trading within a Falling Wedge chart pattern. This is typically a bullish reversal pattern which may come into play given a daily close above its ceiling. A key zone of resistance to watch for seems to be an inflection zone between 49.61 and 49.73. Immediate support sits below at 48.93 which is the 61.8% Fibonacci extension. Falling beyond that exposes the high from October 2016 at 48.66.
Find your trading personality and optimal forms of analysis
USD/PHP Daily Chart
USD/PHP Chart Created in TradingView
Indonesian Rupiah Technical Outlook
The US Dollar is holding its ground against the Indonesian Rupiah as USD/IDR idles on the 14563 inflection point. Last week, a Golden Cross bullish technical signal emerged as the 20-day Simple Moving Average (SMA) crossed above the 50-day one. A bounce from here could place the focus on key resistance at 14827. Closing above this price would open the door to extending the bottom from June. Otherwise, further losses may see USD/IDR pressure support below at 14342.
USD/IDR Daily Chart

USD/IDR Chart Created in TradingView
--- Written by Daniel Dubrovsky, Currency Analyst for DailyFX.com
To contact Daniel, use the comments section below or @ddubrovskyFX on Twitter


