


S&P 500, Dow Jones, DAX 30, Trader Positioning - Talking Points
- S&P 500 and DAX 30 may rise on signals from IG Client Sentiment
- Dow Jones struggling around the 20-day simple moving average
- All 3 may see bearish technical signals emerge if prices rise swiftly
In this week’s webinar on IG Client Sentiment (IGCS), I discussed the outlook for the S&P 500, Dow Jones and DAX 30. For a more detailed overview including fundamental analysis, check out the recording in the video above.
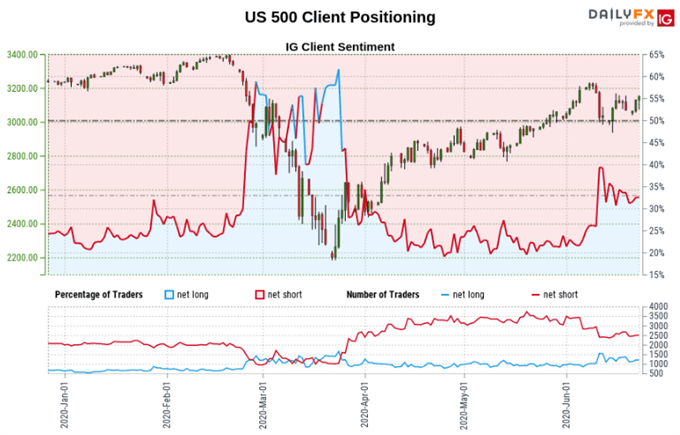
S&P 500 Sentiment Outlook - Bullish
The IGCS gauge implies that 31.94% of retail traders are net long the S&P 500. The number of those exposed to the downside have climbed by 4.15% and 8.69% over the past 24 hours and week respectively. From here, the combination of current sentiment and recent changes gives us a stronger bullish contrarian trading bias. From a psychological standpoint, that may speak to a rising share of traders attempting to pick the next top.
Develop the discipline and objectivity you need to improve your approach to trading consistently
S&P 500 Technical Analysis
On the daily chart below, S&P 500 futures are struggling to close above a key range of resistance between 3118 – 31156. Prices seem to be supported by the 20-day simple moving average which could precede a push higher. In such an event, keep an eye on RSI. A swift climb towards next resistance (3213 – 3231) could open the door to negative divergence, a sign of fading upside momentum.
S&P 500 Futures – Daily Chart
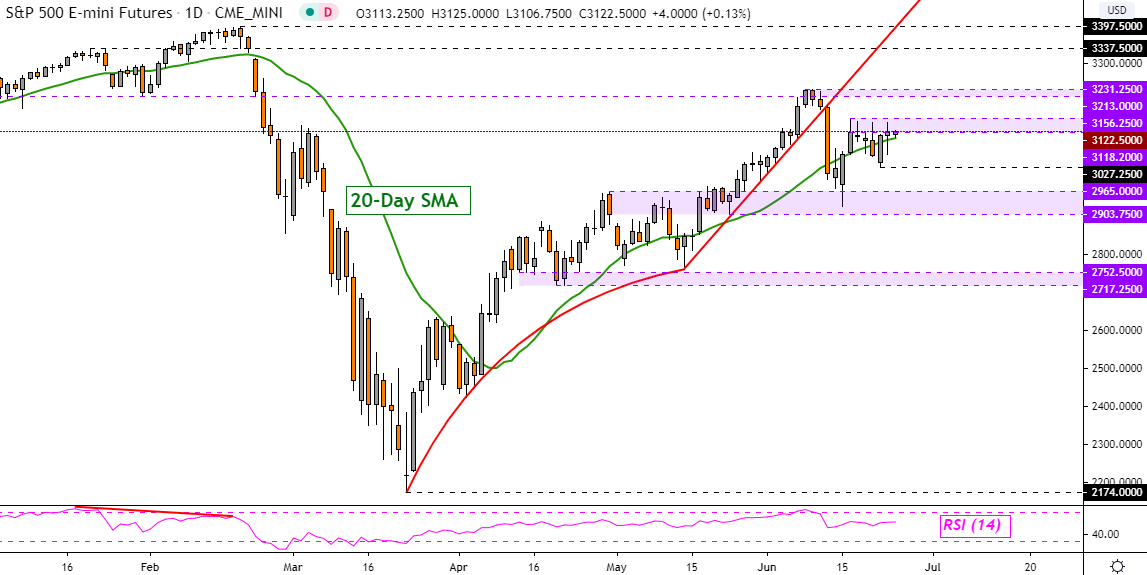
S&P 500 Futures Chart Created in Trading View
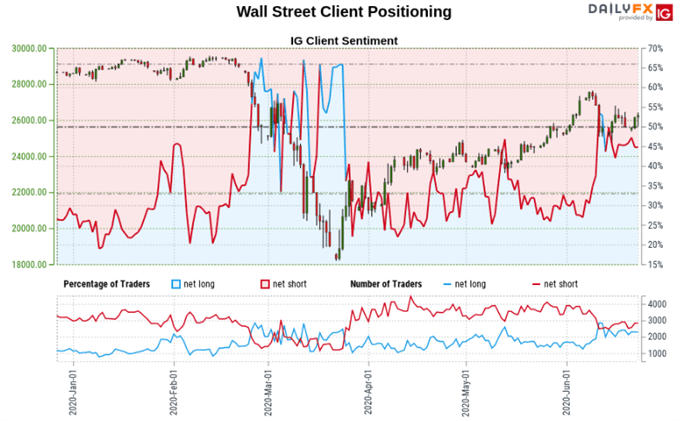
Dow Jones Sentiment Outlook - Mixed
The IG Client Sentiment (IGCS) implies that 45.91% of retail investors are net long the Dow Jones. The number of traders net short are 3.08% down from yesterday. However, over the course of one week, those exposed to the downside have increased by 7.08%. The combination of current sentiment and recent changes gives us a further mixed trading bias.
What are some unique aspects of trading currencies?
Dow Jones Technical Analysis
Dow Jones futures are trading right on the 20-day simple moving average after temporarily falling under it. Prices may struggle to push further as resistance holds between 26193 – 26658. A turn lower from here places the focus on support 25230 followed by the 24507 – 24792 inflection range. Keep a close eye on RSI in the event prices push towards the June 9 high, divergence could emerge and show fading momentum.

Dow Jones Futures - Daily Chart

Dow Jones Chart Created in Trading View
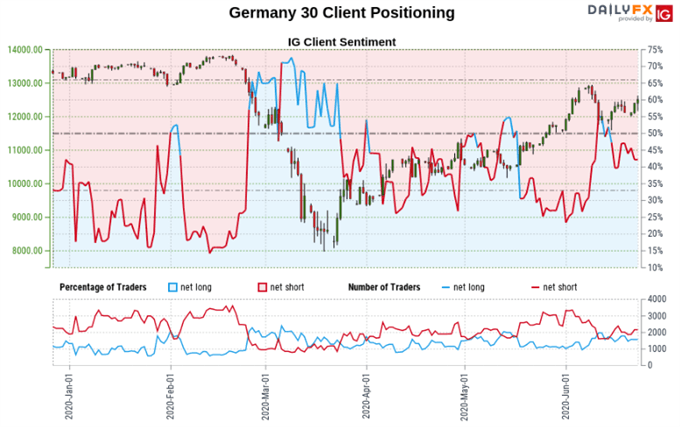
DAX 30 Sentiment Outlook - Bullish
The IGCS gauge implies that 32.26% of retail traders are net long the DAX 30. Those positioned to the downside have increased by 15.91% and 18.81% from yesterday and last week respectively. The combination of current sentiment and recent changes gives us a stronger bullish contrarian trading bias as traders attempt to pick the next top in the German benchmark stock index.
DAX 30 Technical Analysis
On the daily chart below, DAX 30 futures remain in an uptrend which is upheld by rising support from March’s bottom – red line. Recently, prices struggled to drop under the 20-day simple moving average, perhaps speaking to underlying bullish momentum. That could pave the way for a test of early June highs as the focus turns to resistance at 12882. Here too negative RSI divergence can emerge.
DAX 30 Futures - Daily Chart
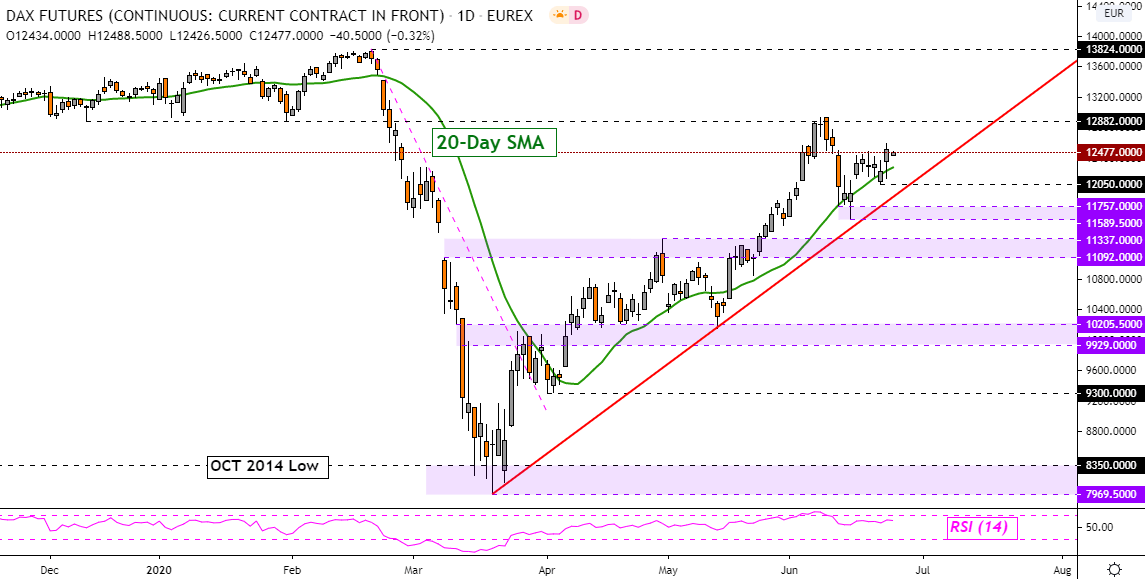
DAX 30 Futures Chart Created in Trading View
*IG Client Sentiment Charts and Positioning Data Used from June 24 Report
--- Written by Daniel Dubrovsky, Currency Analyst for DailyFX.com
To contact Daniel, use the comments section below or @ddubrovskyFX on Twitter


