


US Dollar, Swedish Krona, Norwegian Krone – TALKING POINTS
- US Dollar may weaken against Swedish Krona, Norwegian Krone in week ahead
- USD/SEK recovery after selloff could be short-lived as conviction shows fragility
- USD/NOK is facing a similar dilemma after an aggressive decline in December
USD/SEK Outlook
USD/SEK appears to have bottomed out at the mid-July 2019 support at 9.3000. It has since staged a two percent recovery, though recent price action suggests a bearish correction may be in the cards. The pair once again failed to clear resistance at 9.4996, though the extending wicks signaled a desire to go higher but ultimately it appears conviction was lacking.
USD/SEK – Daily Chart
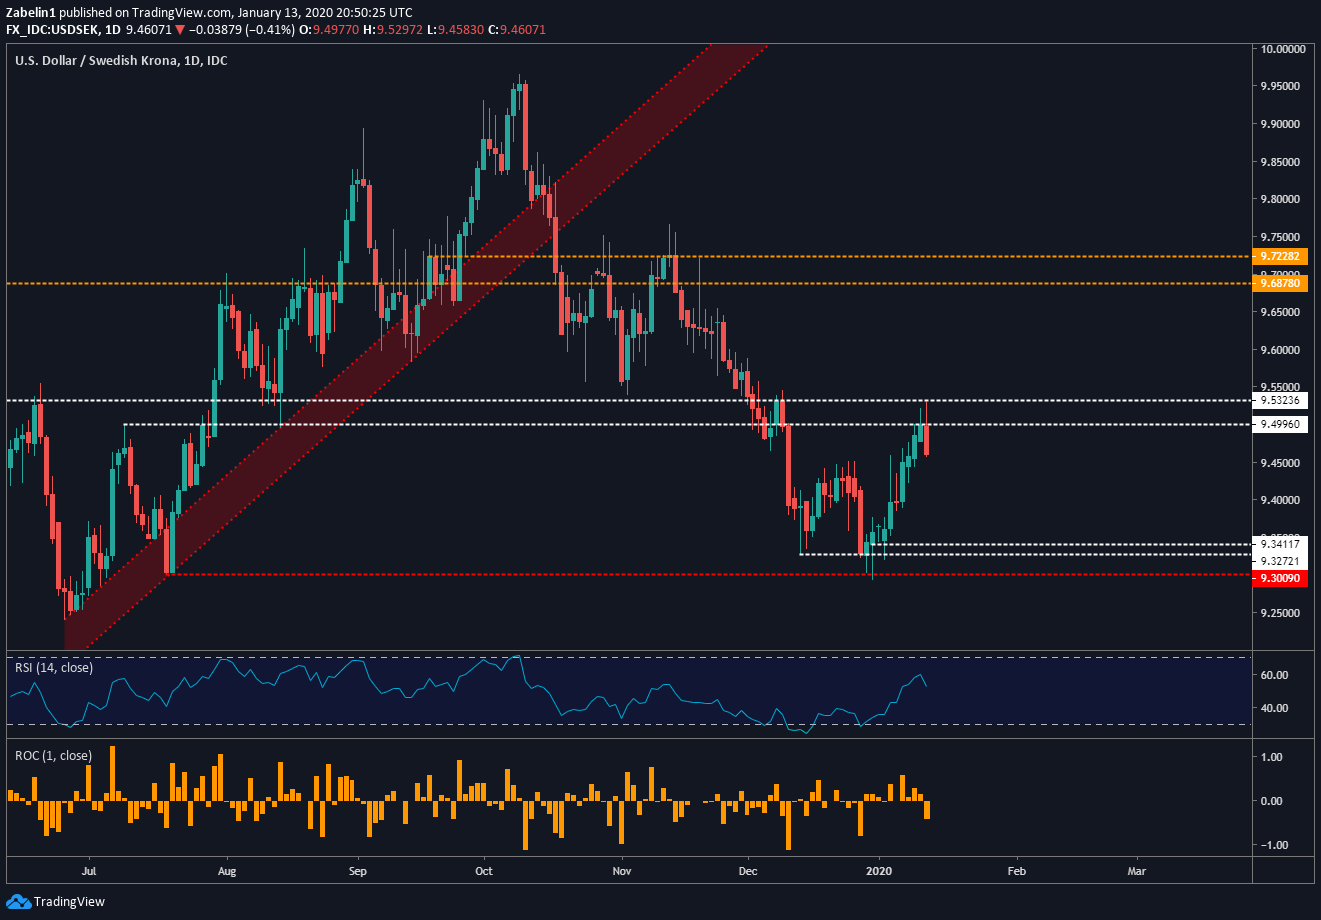
USD/SEK chart created using TradingView
If USD/SEK turns lower, it may encounter soft support around 9.430/453 on its way down before testing the multi-layered floor between 9.3411 and 9.3272 (white dotted lines). Conversely, if the pair manage to crack resistance with follow-through, it could catalyze a bullish spike and lead the pair to re-test November-highs at 9.6878 and 9.7228 (gold-dotted lines).
Looking at a monthly chart shows that despite the pullback towards the latter half of 2019, USD/SEK continues to trade roughly around 18-year highs and only slightly above the spike in 2008. Traders may therefore look to go long once the bearish correction loses steam and the multi-year uptrend is once again in play.
USD/SEK – Monthly Chart
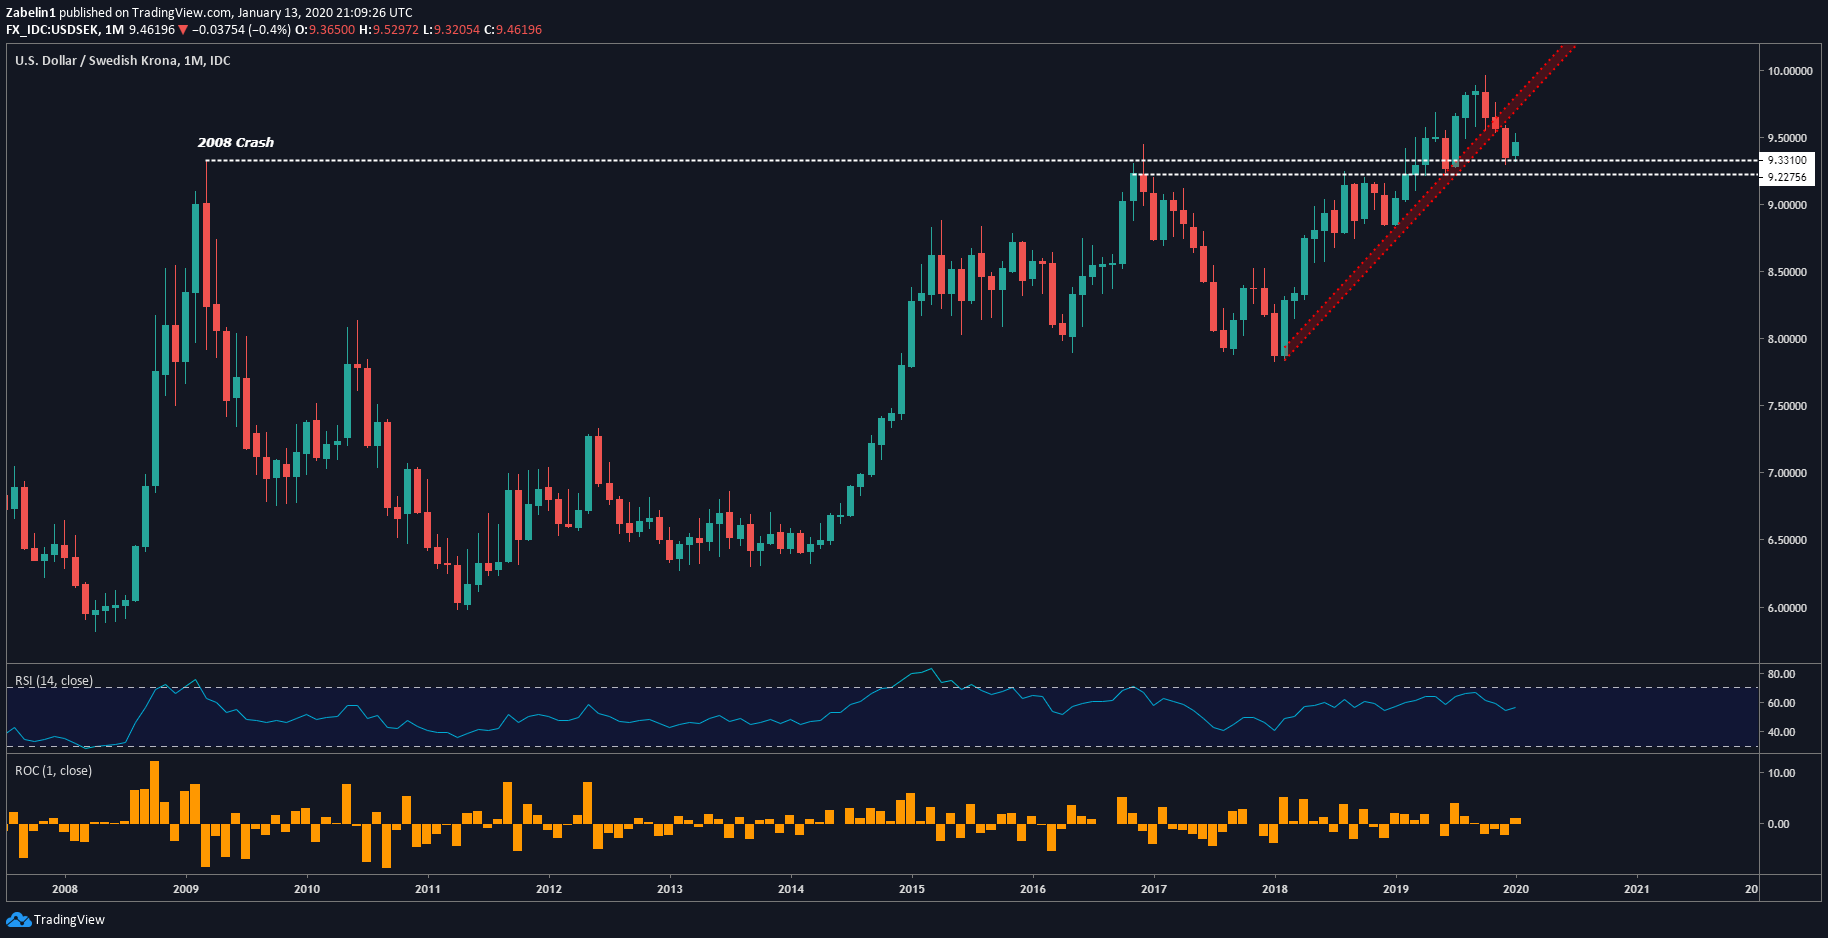
USD/SEK chart created using TradingView
USD/NOK Outlook
Much like USD/SEK, USD/NOK appears to have bottomed out after an aggressive decline in November, due in large part to a market-wide selloff in the US Dollar. After hitting support at 8.7692, USD/NOK has risen around 1.30 percent but confidence to continue higher appears to be fading as the pair approaches resistance. This is demonstrated by the ever-shrinking candle bodies and extending wicks.
USD/NOK – Daily Chart
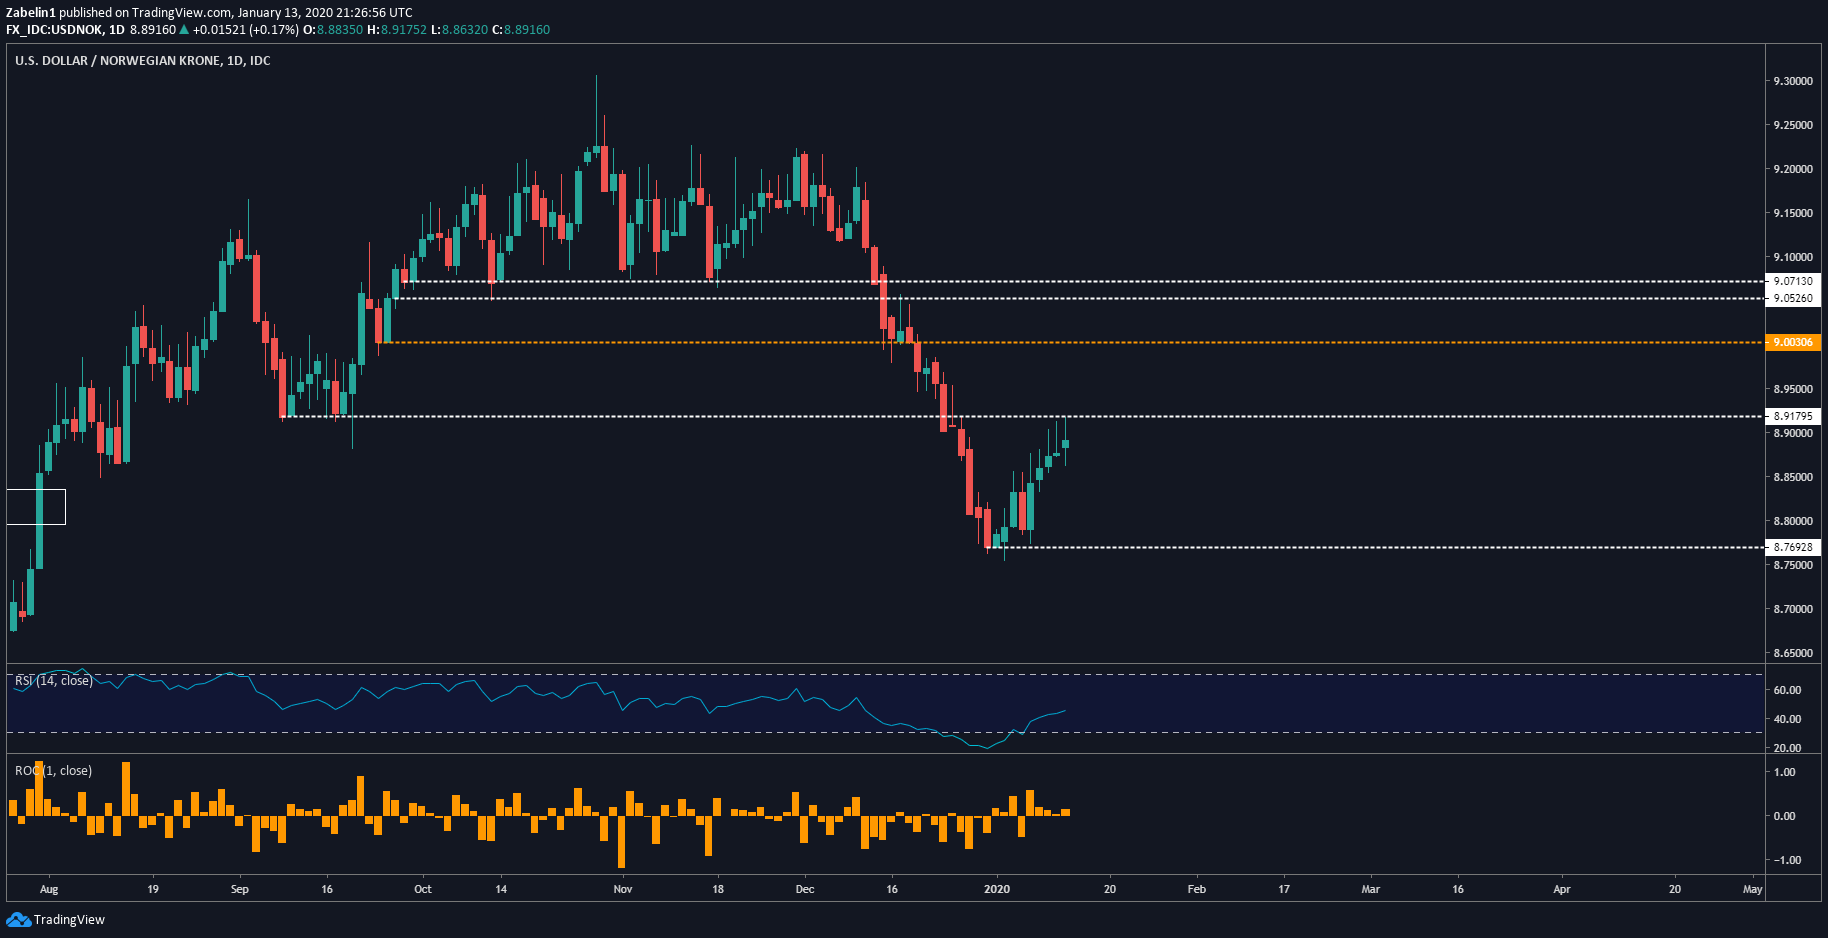
USD/NOK chart created using TradingView
Failure to clear the ceiling may be followed by a selloff as discouraged bulls exit their long positions. However, if it manages to break resistance with follow-through, the next target may be at 9.0030. To get more in-depth technical and fundamental analysis on the Swedish Krona and Norwegian Krone, be sure to follow me on Twitter @ZabelinDimitri.
US DOLLAR TRADING RESOURCES
--- Written by Dimitri Zabelin, Jr Currency Analyst for DailyFX.com
To contact Dimitri, use the comments section below or @ZabelinDimitri on Twitter


