


EUR /CAD and CAD/JPY Technical Analysis
- Euro and Japanese Yen price against Canadian Dollar
- EUR/CAD and CAD/JPY price charts

CAD/JPY, EUR/CAD - Price Action
Last week, EUR/CAD declined to 1.4450 – its lowest level in nearly three months. The price closed the weekly candlestick with a 0.7% loss. Meanwhile, CAD/JPY rallied to its highest level in over eight months at 83.91. However, the pair could not maintain those gains and closed the weekly candlestick on Friday with a 0.5% loss.
This week, the Relative Strength Index (RSI) remained flat below 50 on EURCAD highlighting paused downtrend momentum. On the other hand, the oscillator remained flat above 50 on CAD/JPY reflecting paused uptrend move.
Having trouble with your trading strategy? Need a hand? Here’s the #1 Mistake That Traders Make
EUR/CAD Daily PRice CHART (AUG 25, 2017 – Jan 8, 2020) Zoomed Out

EUR/CAD Daily Price CHART (AUG 1 – Jan 8, 2020) Zoomed in
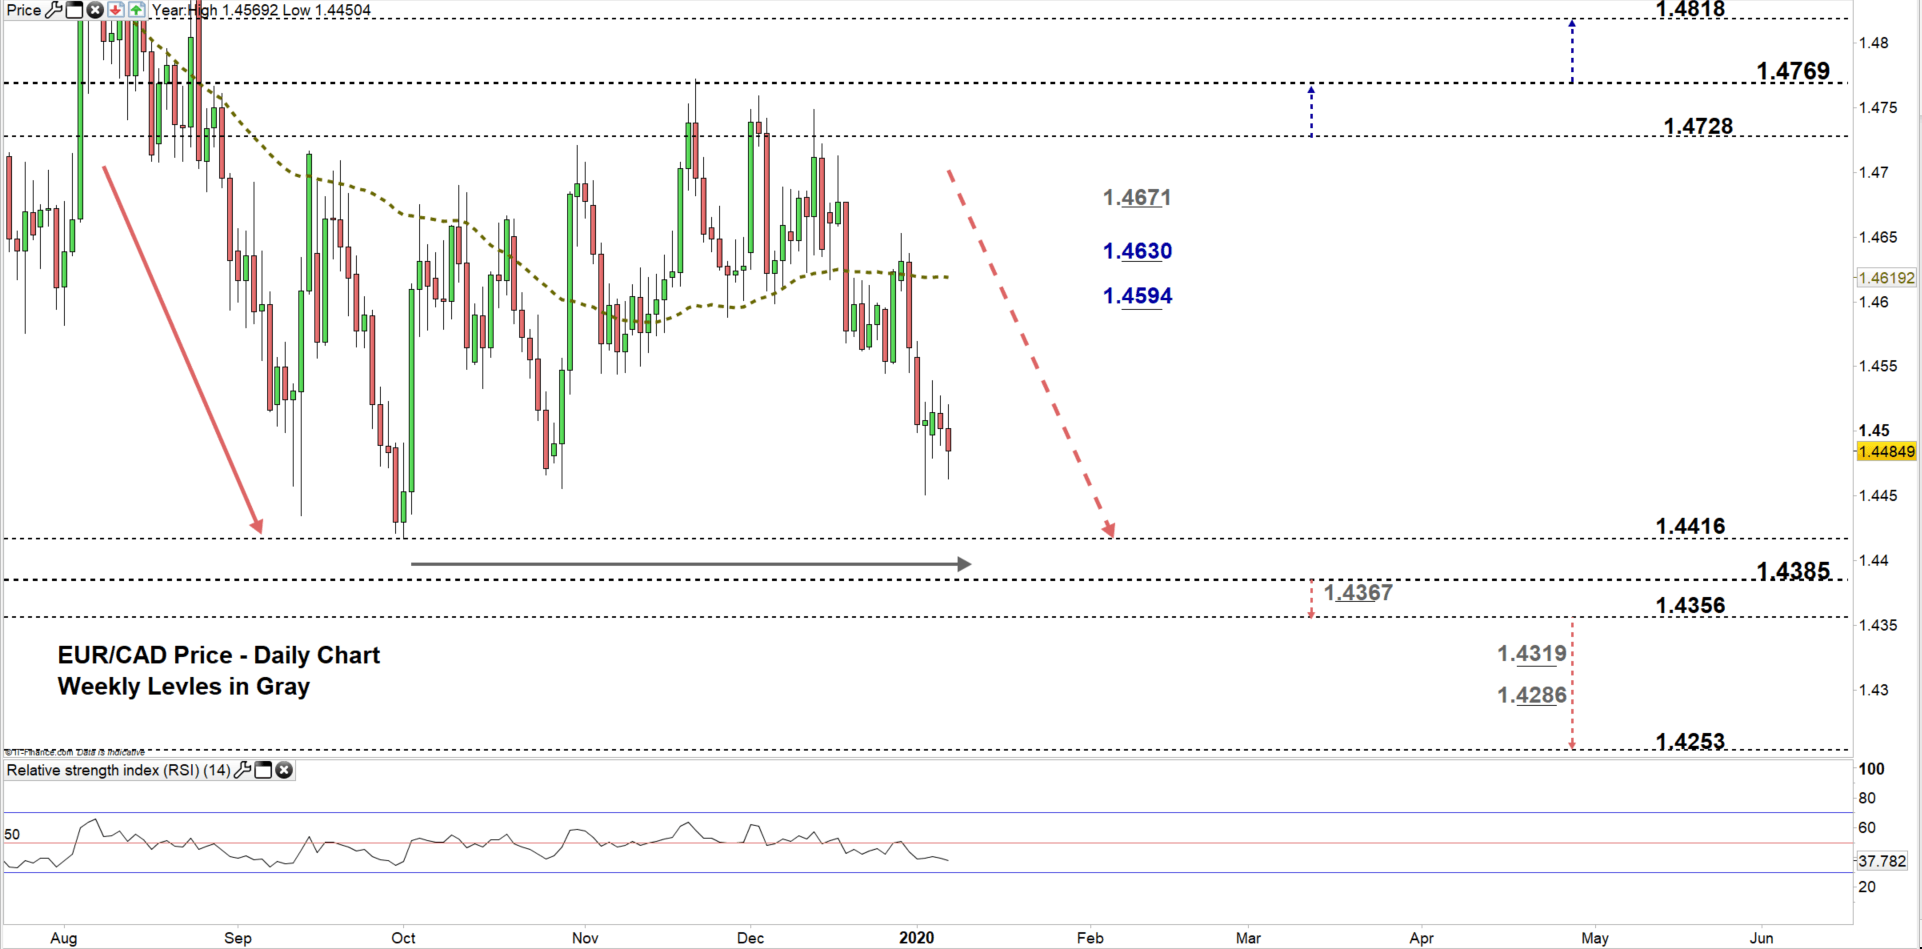
Looking at the daily chart, we notice on Dec 12 EUR/CAD rallied to 1.4748 then some buyers took profit. This kept the price in the same trading zone 1.4416 – 1.4728. Currently, the pair eyes a test of the low end of it as more buyers could exit the market.
Thus, a close below 1.4385 may pave the way for sellers to press towards 1.4356. Further close below this level could encourage more sellers to join the market and send EURCAD towards 1.4253. Yet, the weekly support levels marked on the chart should be kept in focus.
Having said that, any failure in closing below the low end of the zone could reverse the pair’s direction towards the high end of the zone. Nevertheless, the daily and weekly resistance levels underlined on the chart should be watched closely.

CAD/JPY Daily PRice CHART (JAN 25, 2018 – Jan 8, 2020) Zoomed Out

CAD/JPY Daily PRice CHART (June 23 – Jan 8, 2020) Zoomed In

From the daily chart, we notice since Dec 27 CAD/JPY has failed in multiple occasions to move to a higher trading zone. The price remained in the same zone 82.72 – 83.74 as some buyers exited the market.
Thus, a close below the low end of the zone would increase the likelihood for CADJPY to decline towards 82.26. Further close below this level opens the door for sellers to press towards 81.44. In that scenario, the weekly support levels underlined on the chart (zoomed in) should be considered as some market participant may exit the market at these points.
On the other hand, a successful close above the high end of the zone could embolden buyers to push CADJPY towards 84.82. Although, the weekly resistance levels underscored on the chart would be worth monitoring.
Just getting started? See our Beginners’ Guide for FX traders
Written By: Mahmoud Alkudsi
Please feel free to contact me on Twitter: @Malkudsi


