


GOLD, DOW & BITCOIN CHARTS HINT AT BREAKOUT POTENTIAL HEADED INTO 2020
- Gold prices (XAU/USD) could be showing preliminary signs that the precious metal is resuming its rally subsequent to its 4-month long consolidation
- The Dow Jones Industrial Average (DJIA) has already embarked on its topside breakout and the major US equity index has potential to continue churning higher into the new year
- The price of Bitcoin (BTC/USD) is beginning to rebound from its recent selloff as the cryptocurrency gains upward momentum after bouncing off a key technical level
Various asset classes are on pace to notch impressive gains for 2019 with spot Gold, the Dow and Bitcoin prices surging 17%, 22% and 90% respectively year-to-date. More recently, upward momentum has begun to pick up for the aforementioned commodity, equity index and cryptocurrency.

That said, a confluence of fundamental and technical developments like surging global liquidity (such as the Fed’s balance sheet) and breakout signals show potential of carrying spot Gold, the Dow and Bitcoin prices higher headed into the early trading days of 2020.
GOLD PRICE CHART: DAILY TIME FRAME (MAY 2019 TO DECEMBER 2019)
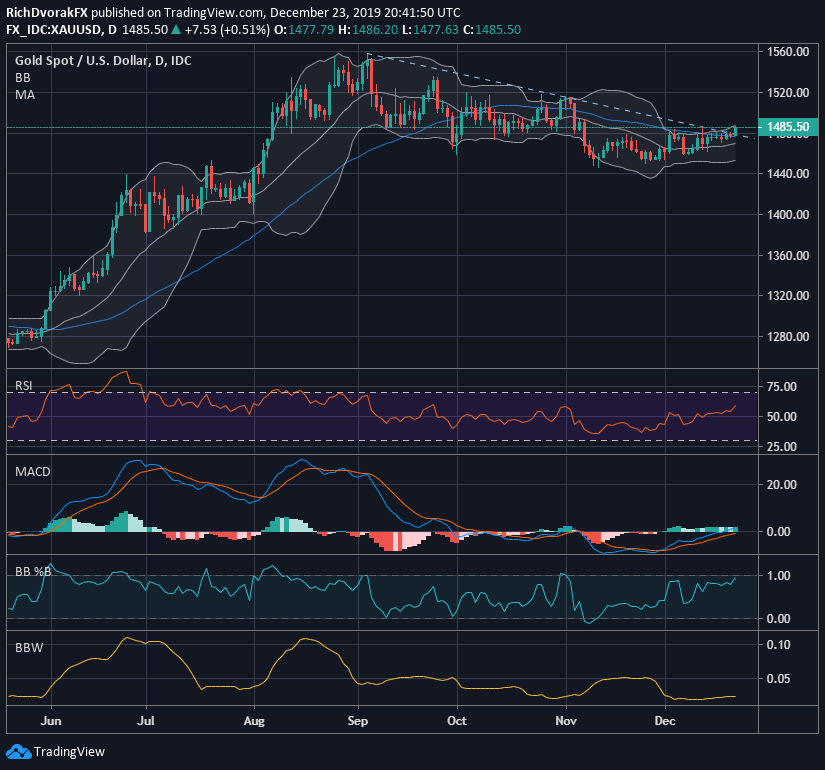
Chart created by @RichDvorakFX with TradingView
The price of gold is already showing promise of its resurgence after topping its downward-sloping resistance trendline connecting the September 04, November 01 and December 12 intraday highs. Recent strength exhibited by XAU/USD is illustrated by its RSI climbing back above 50 and there seems to be potential for the precious metal to march higher before running into a reading above 70 – deemed “overbought territory.”
For insight on how to trade gold, check out these Top Gold Trading Strategies and Tips
A possible obstacle for gold prices could be the zone of confluent resistance around the $1,500-1,515 level, which is underpinned by the mid-point and 61.8% Fibonacci retracement of the commodity’s trading range since printing its 2019 high around the $1,555 mark.
DOW JONES PRICE CHART: DAILY TIME FRAME (APRIL 2019 TO DECEMBER 2019)

Chart created by @RichDvorakFX with TradingView
The rally in global equities was quite impressive – driven largely by dovish monetary policy action and hopes that the painful trade war between Beijing and Washington will not deepen – and the US stock market certainly stood out as a top performer. The Dow staged a monumental 22% return in the year-to-date, albeit the bumpy ride along the way.
Take a look at these strategies, tips and trading signals for Day Trading the Dow Jones
The Dow is currently trading around all-time highs with the blue-chip benchmark on pace to record a 4% rally during December. Although the Dow Jones is riding the upper channel of its 2-standard deviation Bollinger Band, the possibility of higher US stock prices seems more likely than not (barring no destabilizing volatility event). One encouraging technical development is the expanding width of the Bollinger Band, which, statistically speaking, could help facilitate further upside potential.

Also, the Dow recently surmounted the 141.4% Fibonacci extension of its bearish leg etched out from July 16 to August 15, which opens up the door for equity bulls to target the 161.8% Fib. This level of confluence is also highlighted approximately by the upward-sloping trendline, which could pose as an area of technical resistance.
BITCOIN PRICE CHART: DAILY TIME FRAME (JULY 2019 TO DECEMBER 2019)
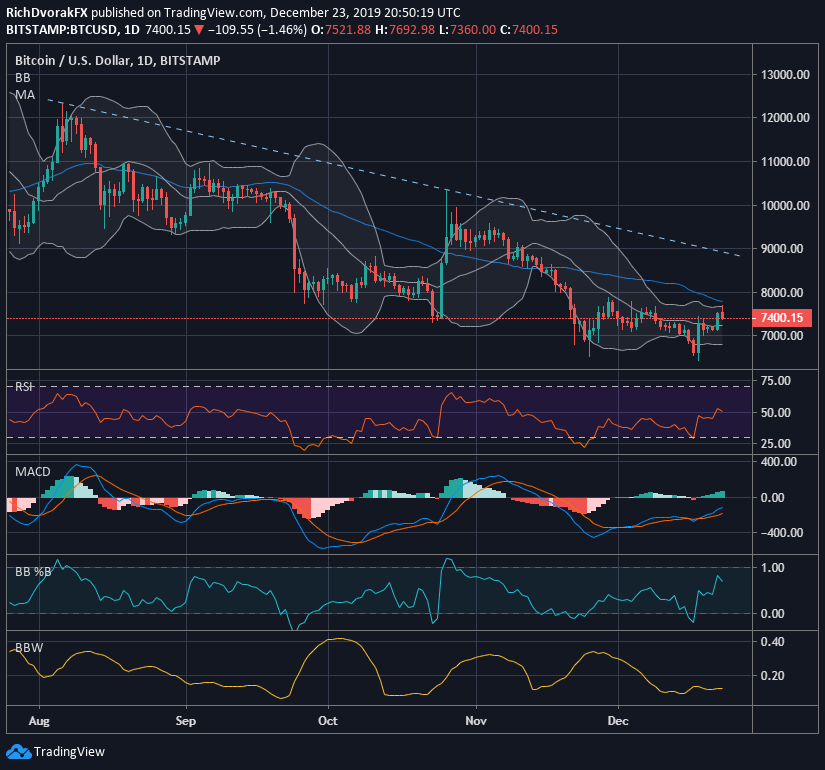
Chart created by @RichDvorakFX with TradingView
Bitcoin is set to be 2019’s top performing asset with its near-100% spike over the last 12-months despite sliding roughly 45% from its June 26 swing high around $13,850. Though Bitcoin looks set to embark on another one of its volatility cycles after consolidating lower (depicted by its Bollinger Band squeeze) into a major support level around the psychologically-significant $7,000 price.

Eclipsing $7,800 could see crypto traders target the $9,000 price level where the downtrend line extended through August’s swing high and October’s lower swing high may hinder further upside progress. Nevertheless, the MACD indicator speaks to upward momentum gaining pace as BTC prices record positive divergence.
-- Written by Rich Dvorak, Junior Analyst for DailyFX.com
Connect with @RichDvorakFX on Twitter for real-time market insight


