


EUR/GBP, GBP/CAD, GBP/AUD, GBP/USD– TALKING POINTS
- EUR/GBP plummeted to 19-month low as UK election electrifies British Pound
- GBP/CAD, GBP/USD both aiming at critical resistance: bullish reversal ahead?
- GBP/AUD reaches three-year high but technical cues sending alarming message
Learn how to use political-risk analysis in your trading strategy !
EUR/GBP Plunges to 19-Month Low. What Next?
The British Pound surged against all its major counterparts and sent EUR/GBP to 19-month lows despite positive RSI divergence showing fading downside momentum. The pair has now also entered a two-year range which has acted as support following the 2016 Brexit referendum. Looking ahead, the pair may attempt to re-test the lower bound of the 0.8491-0.8337 support zone.
EUR/GBP – Daily Chart
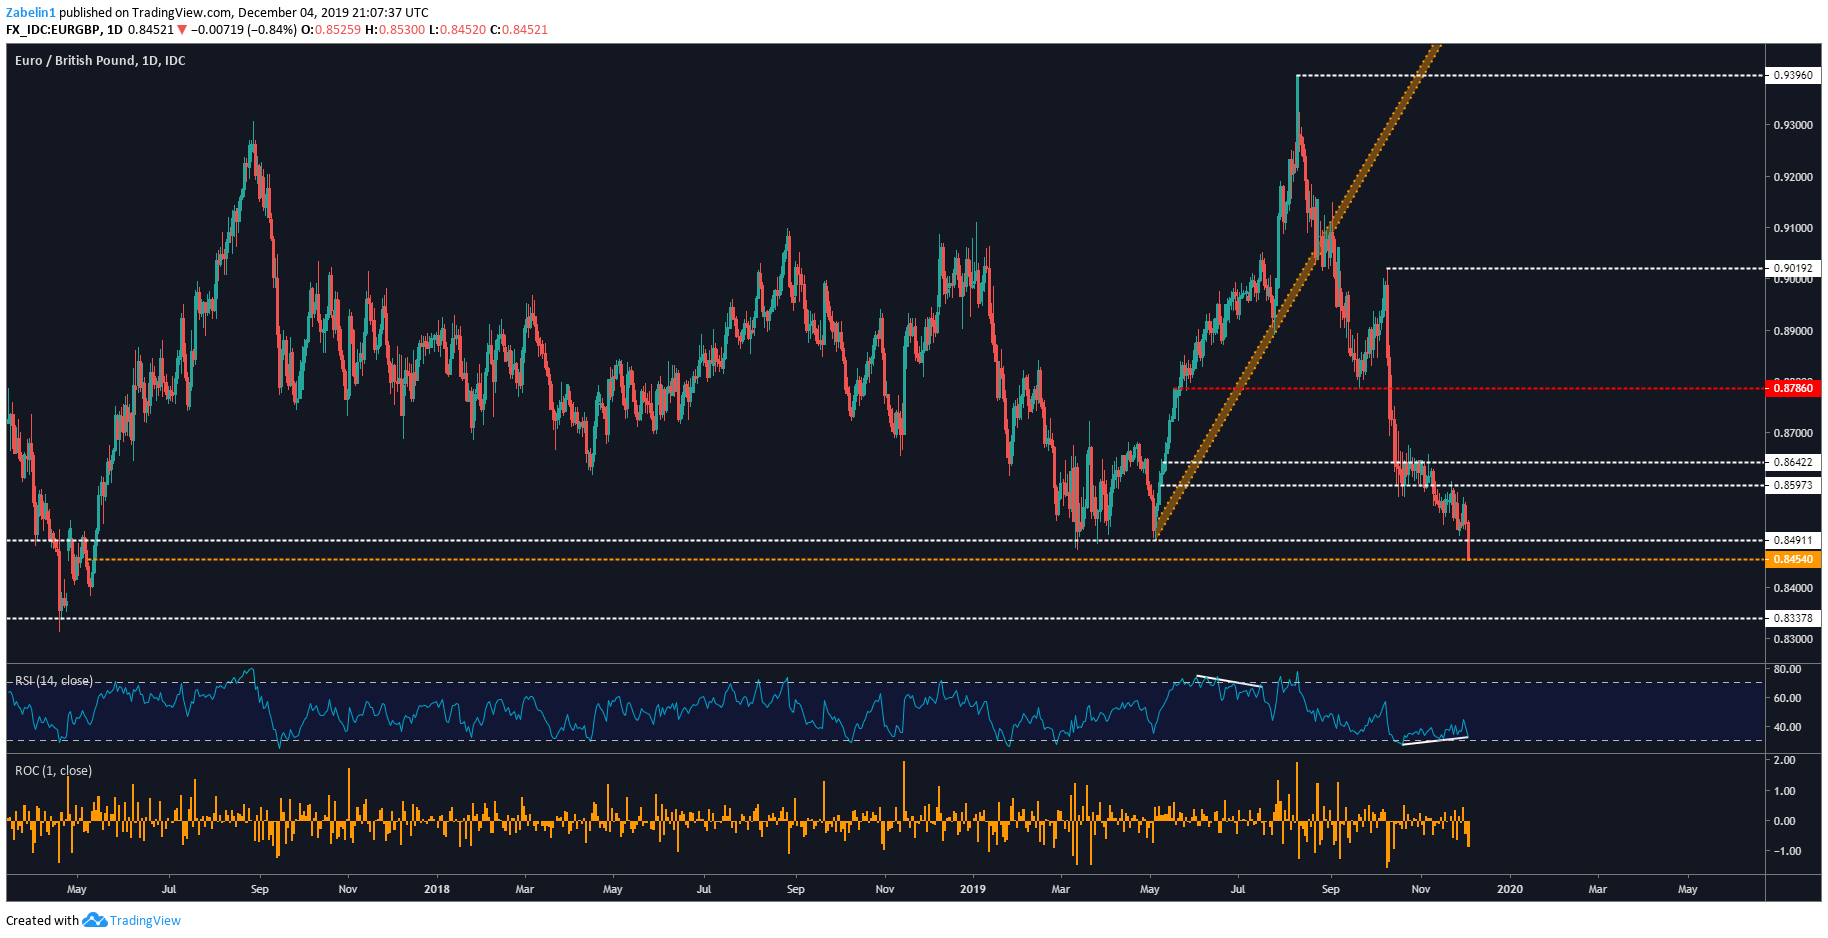
EUR/GBP chart created using TradingView
Looking at a weekly chart more effectively illustrates the significance of re-testing the two-year support range. While reaching the lower lip is certainly possible, breaking below it may not occur until more clarity is given on the outcome of Brexit. A fundamental catalyst of that magnitude may be required to facilitate a downside breakout with meaningful follow-through.
EUR/GBP – Weekly Chart

EUR/GBP chart created using TradingView
GBP/CAD Aiming to Retest 3-Year Resistance Range
GBP/CAD also rallied, though upside momentum was curbed after the Bank of Canada rate decision and subsequent commentary sent the Canadian Dollar higher. Nonetheless, the pair is edging closer to re-testing descending 3-year resistance. If the ceiling holds, a wave of disappointed bulls may close their positions, opening the door to a possible market-wide selloff.
GBP/CAD – Weekly Chart
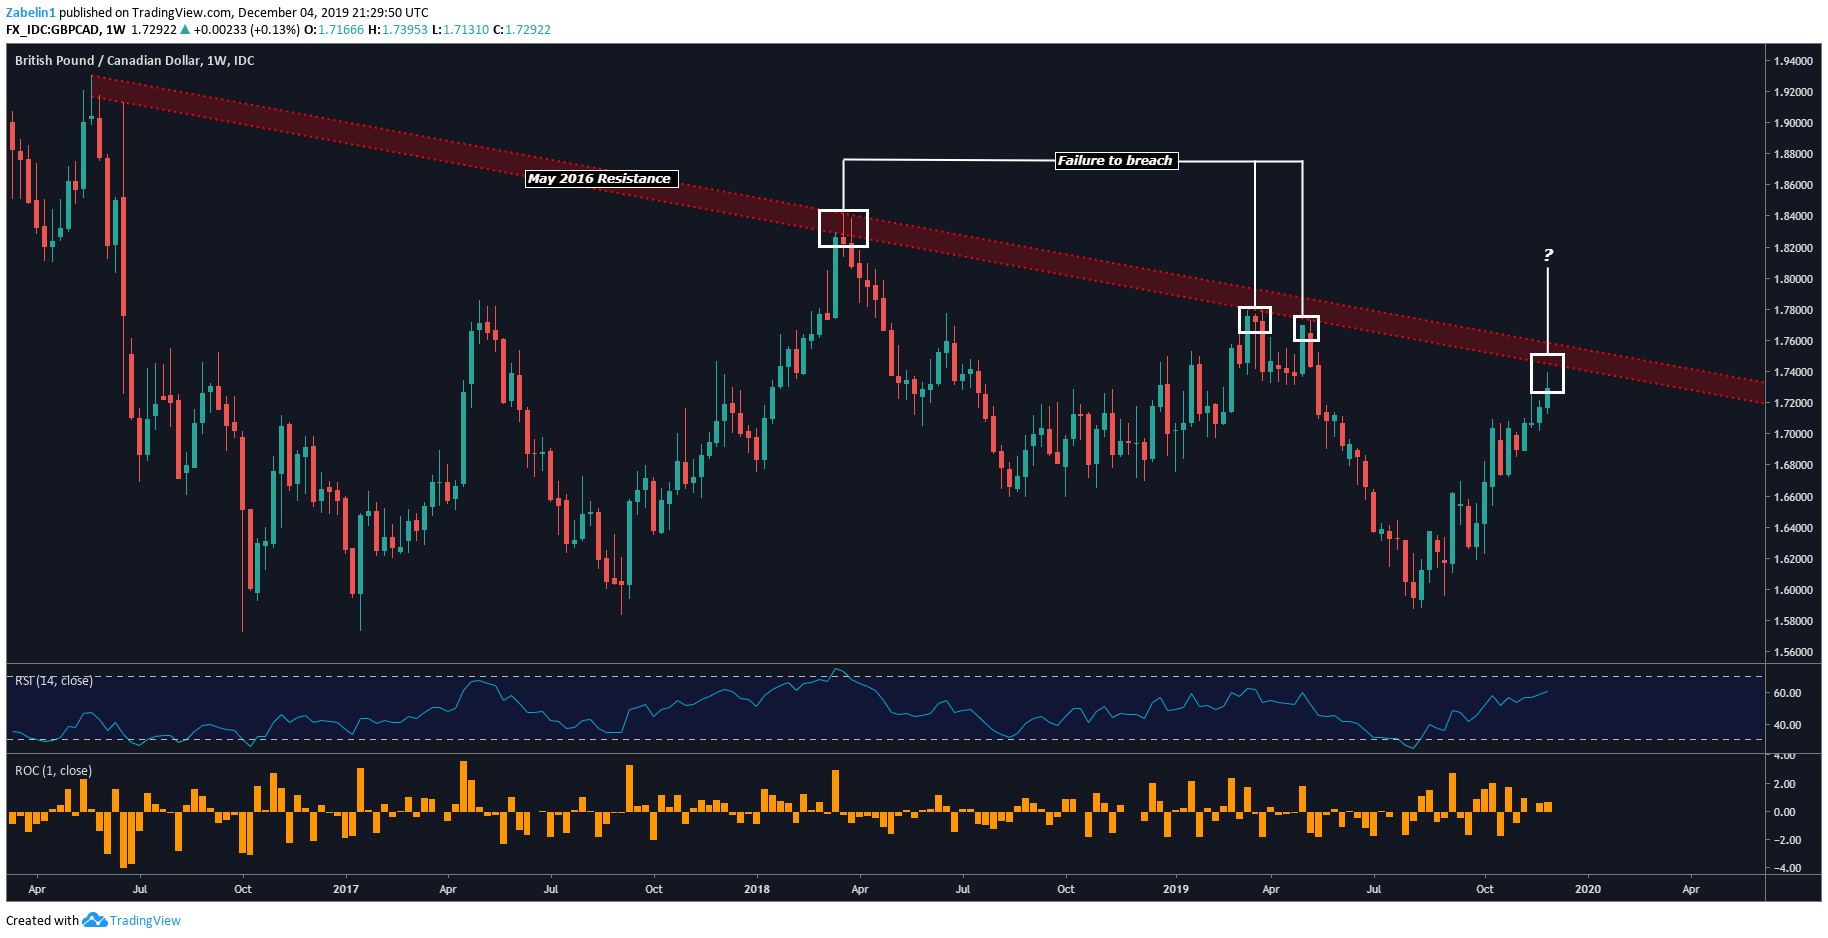
GBP/CAD chart created using TradingView
Looking at a daily chart also shows negative RSI divergence, indicating that as the pair approached formidable resistance, upside momentum began to ebb. While this does not necessarily precede a downturn, it is still something that warrants traders’ attention.
GBP/CAD – Daily Chart

GBP/CAD chart created using TradingView
GBP/USD Eying Critical Resistance
Despite signs of fading upside momentum, GBP/USD broke above 1.2816 and may now aim to touch key resistance at 1.3177. A break beyond that may open the door to test a short but formidable multi-layered ceiling between 1.3263-1.3307. A break above this range with follow-through would effectively erase all the losses incurred since the beginning of the year.
GBP/USD – Daily Chart

GBP/USD chart created using TradingView
However, zooming out to a weekly chart shows another – albeit gloomier – picture for GBP/USD bulls. While the pair is on the cusp of re-testing a five-year descending resistance channel, a break above it may not necessarily mark a tectonic shift. Rather, it would signal that the slope of depreciation may now become less steep.
GBP/USD – Weekly Chart

GBP/USD chart created using TradingView
GBP/AUD Technical Cues Showing Alarming Signs
Much like GBP/USD, GBP/AUD is also showing signs of fading upside momentum right as the pair reach a three-year high following the surge in the British Pound. Looking ahead, traders will be anxiously watching to see if the pair continues higher or capitulates. Given the negative RSI divergence, the path of least resistance might support a short-term bearish correction with an eye at the November 7 swing-low at 1.8547.
GBP/AUD – Daily Chart

GBP/AUD chart created using TradingView
BRITISH POUND TRADING RESOURCES
- Join a free webinar and have your trading questions answered
- Just getting started? See our beginners’ guide for FX traders
- Having trouble with your strategy? Here’s the #1 mistake that traders make
--- Written by Dimitri Zabelin, Jr Currency Analyst for DailyFX.com
To contact Dimitri, use the comments section below or @ZabelinDimitri on Twitter


