


USD/TRY Price Forecast,
Did we get it right with our EUR and USD Dollar forecasts? Find out more for free from Q3 main Currencies and Commodities forecasts
USD/TRY Trendless Move
On Thursday USD/TRY broke below the level discussed in our previous update at 5,6550, then rebounded and closed the weekly candlestick with a near 1.1% loss. At the start of this week, the pair firmed slightly however, continued trading in a trendless move.
Alongside this the Relative Strength Index (RSI) rose from 36 and stayed flat at 48, reflecting the buyers unsuccessful attempt to start an upside trend.
Having trouble with your trading strategy? Here’s the #1 Mistake That Traders Make
USD/TRY DAILY PRICE CHART (Aug 3, 2018 – JULY 24, 2019) Zoomed Out

USD/TRY DAILY PRICE CHART (May 12 – JUL 24, 2019) Zoomed In
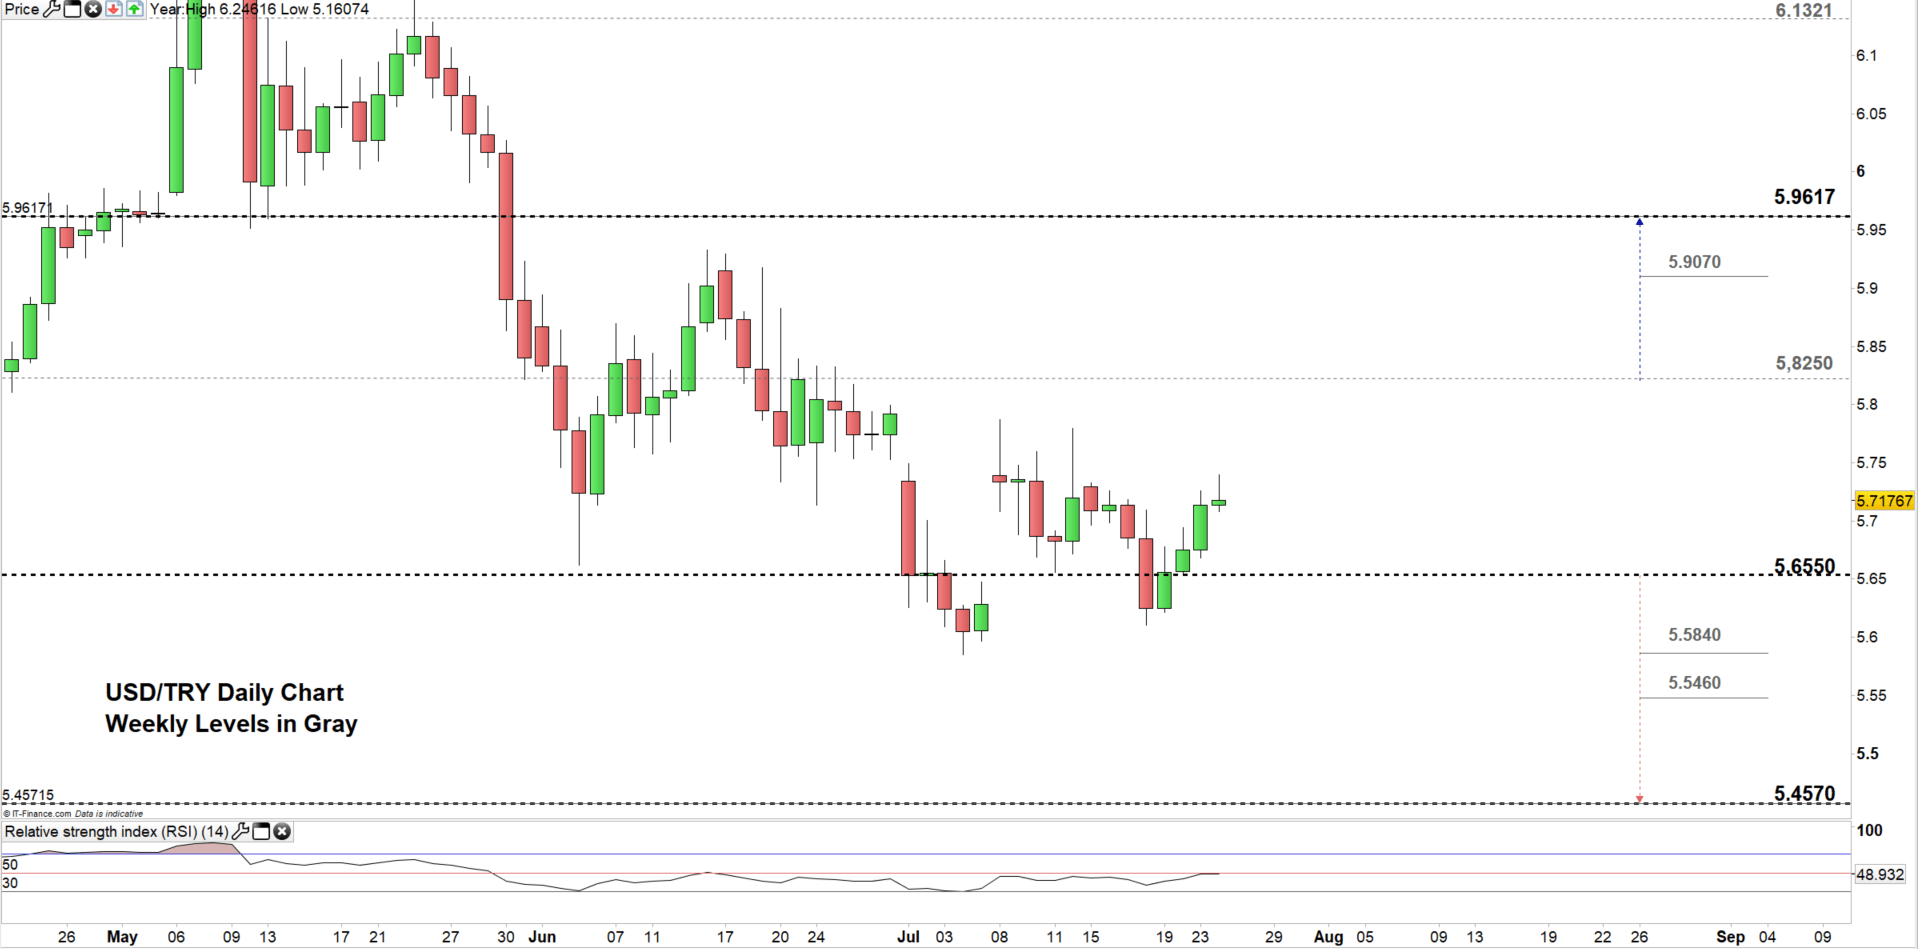
Looking at the daily chart we noticed on Monday USD/TRY moved to the higher trading zone 5,6550 – 5.8250 and currently eyes a test of the high end of this zone. Therefore, if the pair closes above the high end this could cause a rally towards 5.9617. However, the weekly resistance underlined on the chart (zoomed in) should be watched closely.
In turn, any failure in closing above the high end of the trading zone could press the pair towards the low end. Further close below the low end may send the price towards 5.4570. Nonetheless, the weekly support levels marked on the chart (zoomed in) would be worth monitoring.
Just getting started? See our Beginners’ Guide for FX traders
USD/TRY Four-HOUR PRICE CHART (May 22, 2019 – JuL 2, 2019)
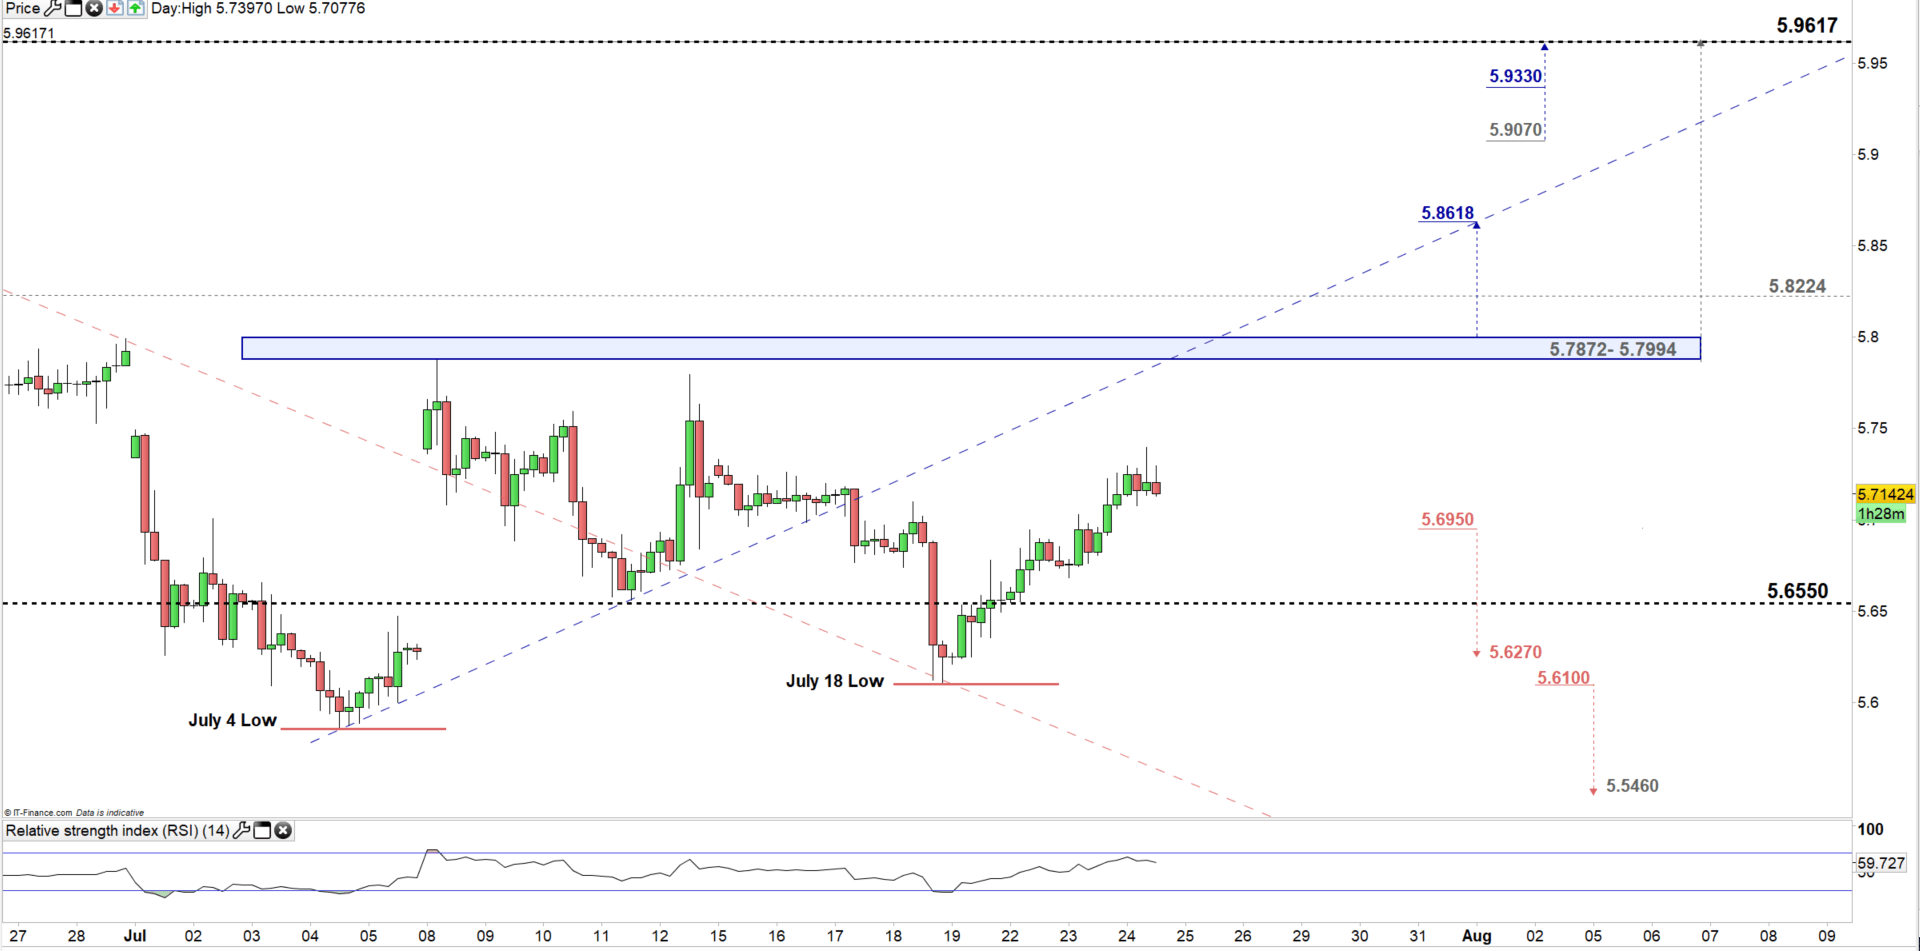
Looking at the four-hour chart we notice USD/TRY rebounded twice this month from below the low end of the aforementioned trading zone. The pair eyes a test of the neckline of the double bottom pattern residing at 5.7994. Hence, a break above this level may lead USD/TRY towards 5.8618. However, the high end of the current trading zone needs to be kept in focus. See the chart to know more about the next significant resistance if the price rallies above mentioned levels.
On the flip-side, a break below 5.6950 may send the price towards 5.6270 although, the low end of the current trading zone should be monitored. See the chart for more key support levels if the selloff continues below mentioned levels.
Written By: Mahmoud Alkudsi
Please feel free to contact me on Twitter: @Malkudsi


