


USD/TRY Price Forecast,
Did we get it right with our EUR and USD Dollar forecasts? Find out more for free from Q3 main Currencies and Commodities forecasts
USD/TRY – Correcting Higher
Last week USD/TRY opened with an upward gap at 5.787, then slipped back creating a higher low at 5,655.
Alongside this the Relative Strength Index (RSI) remained flat below 50 indicting the lack of momentum to start an upside move.
Having trouble with your trading strategy? Here’s the #1 Mistake That Traders Make
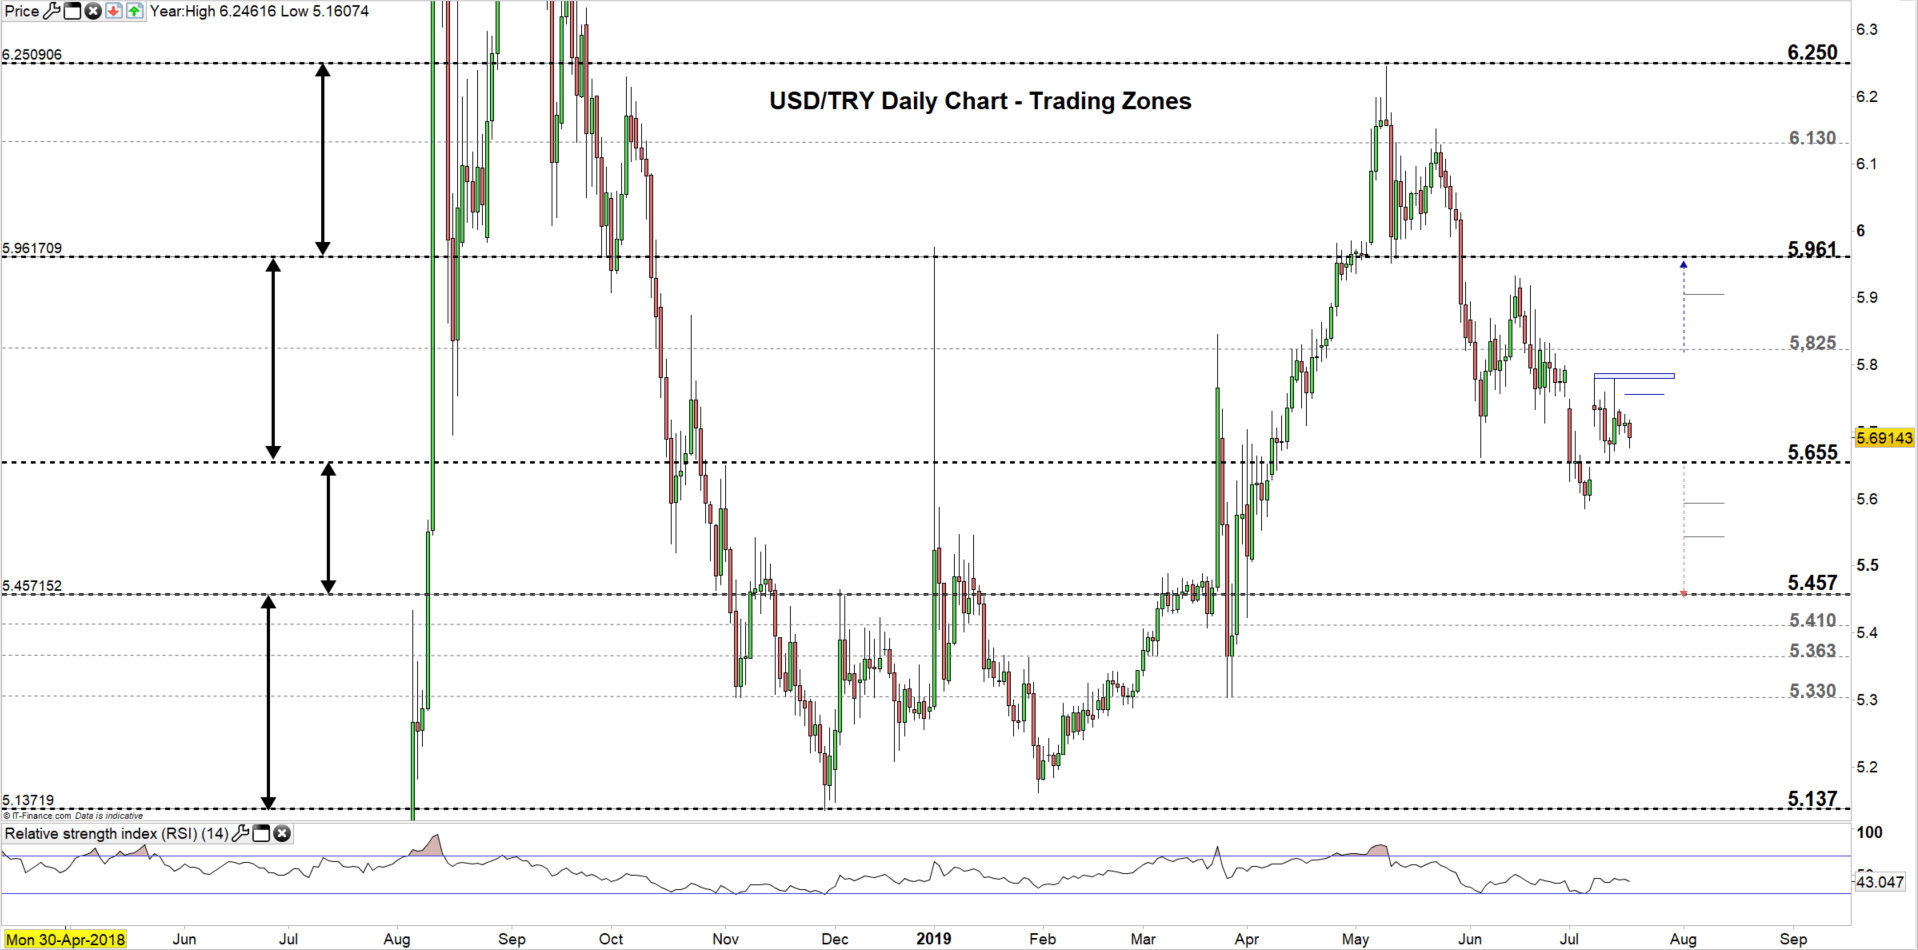
USD/TRY DAILY PRICE CHART (Aug 3, 2018 – JULY 17, 2019) Zoomed Out
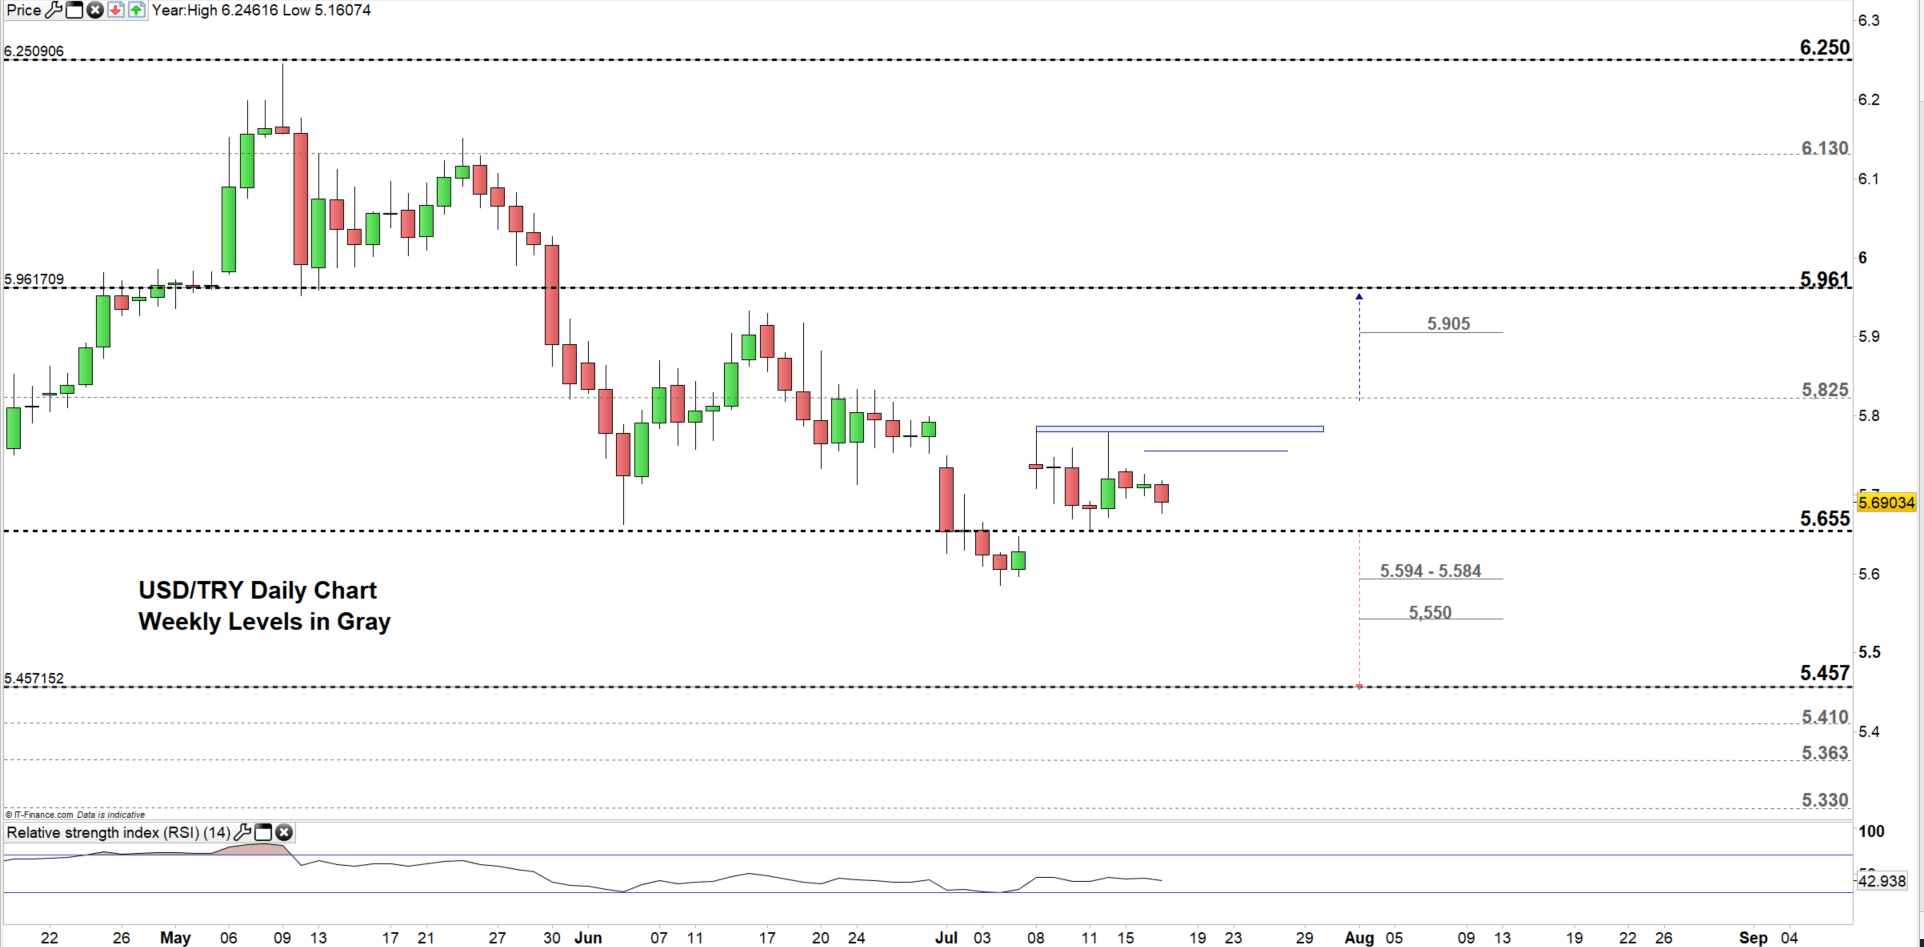
USD/TRY DAILY PRICE CHART (April 18 – JUL 17, 2019) Zoomed In
Looking at the daily chart we notice on July 11 USD/TRY rebounded from the boundary of the current trading zone 5.655 – 5.825 however, the pair U-turned on the following day before reaching the high end, reflecting the buyer’s weakness to keep rallying the price.
Therefore, a close below the low-end of this zone may press the price lower towards 5.457 nonetheless, the weekly support levels underlined on the chart (zoomed in) need to be kept in focus.
In turn, any failure to close below the low- end may send the price towards the high-end although, the daily resistance zone between 5.779 up to 5.787 should be watched closely. See the chart to find out about the key points in a further bullish scenario.
Just getting started? See our Beginners’ Guide for FX traders
USD/TRY Four-HOUR PRICE CHART (May 22, 2019 – JuL 2, 2019)
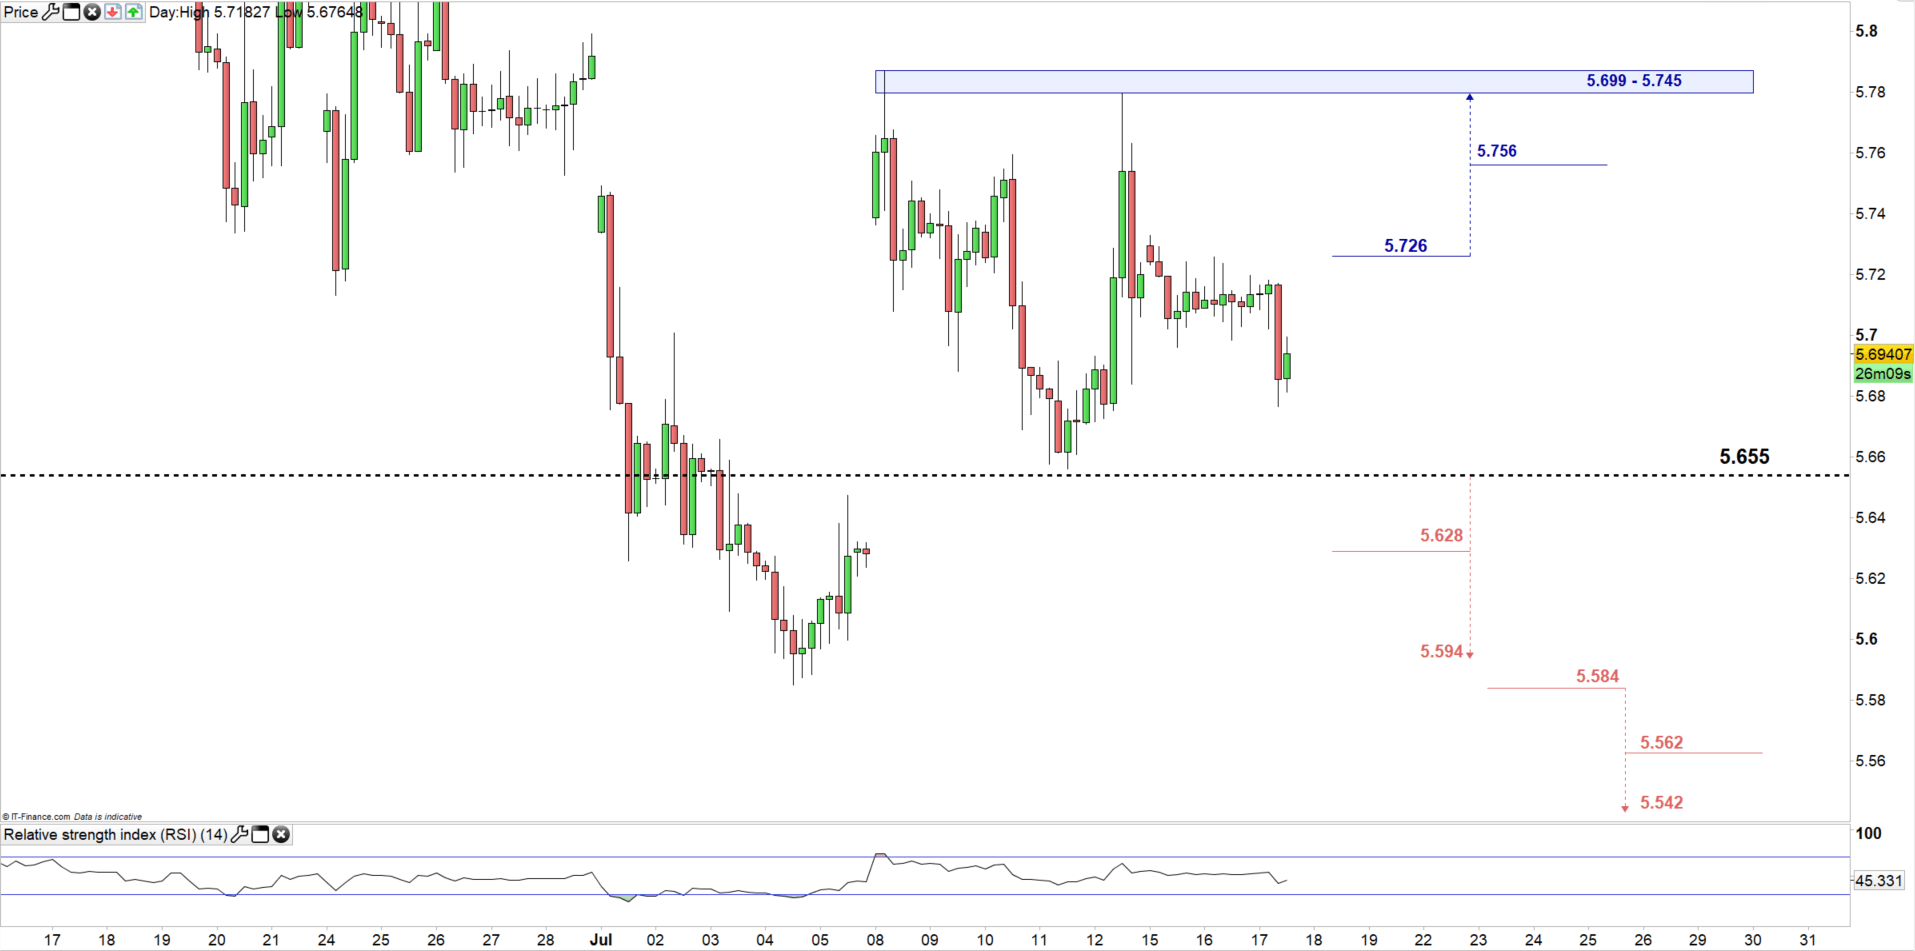
Looking at the four-hour chart, we notice yesterday USD/TRY peaked at 5.726 then declined eyeing the low-end of the aforementioned trading zone. Hence, any break above yesterday’s high may cause the price to rally towards the July 12 high at 5.699 although, the daily resistance marked on the chart needs to be monitored.
On the other hand, if the price breaks below the low-end of the trading zone, it may trade even lower towards 5.594 however, the daily support at 5.628 should be considered. See the chart to know more about the next significant support the pair may encounter below mentioned levels.
Written By: Mahmoud Alkudsi
Please feel free to contact me on Twitter: @Malkudsi


