


NORDIC FX, NOK, SEK WEEKLY OUTLOOK
- USDNOK approaching critical 15-month rising support after break below
- USDSEK is resuming the dominant uptrend as bullish momentum recovers
- NOKSEK’s Symmetrical Triangle pattern suggests a bearish capitulation
See our free guide to learn how to use economic news in your trading strategy !
USDNOK RAMPING UP TO RESUME MARCH 2018 UPTREND?
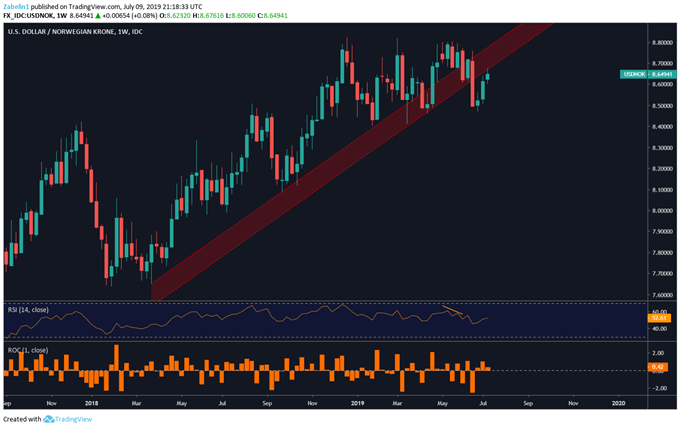
After breaking below critical 15-month rising support (red parallel channel), USDNOK briefly hovered in the 8.5-8.6 range as the pair’s wobbly legs began to become sturdy again. On July 5, the pair jumped a little over one percent, and the surge appears to be continuing with it now testing the lower lip of the support zone. The speedy recovery speaks to an underlying bullish bias as US Dollar strength returns after a brief pullback.
USDNOK Retesting Critical Rising Support

The next likely barrier to overcome if the pair does not breach the key zone within the next few days will resistance at 8.6937. If buyer’s resolve fails to push the higher beyond this point, the path of least resistance suggests the pair will hover between that ceiling and 8.6049.
Zooming out to a weekly chart shows a favorable trajectory for the pair. Since March 2018, USDNOK has been on a steady and steep incline with what looks like will be a temporary deviation from the long climb. For the past two weeks, USDNOK has closed consecutively higher, and if the current trend continues, it will be three. Supportive fundamentals of a strong USD will likely be the driving force behind the pair’s recovery.
US Recovery, Weak Crude Oil Prices Likely to Boost USDNOK
USDSEK CLOSES ABOVE 19-MONTH RISING SUPPORT: BULLISH SPIKE AHEAD?
Much like USDNOK, USDSEK also broke through a major support channel and temporarily deviated away from its 19-month uptrend. However, rising strength in the US Dollar is supporting a resurrection of the previous uptrend, and will likely face acceleration after the broke above critical support (red parallel channel). Revitalized underlying bullish momentum may be the pair’s tailwind until it reaches familiar resistance.
USDSEK Ready to Resume Previous Uptrend?
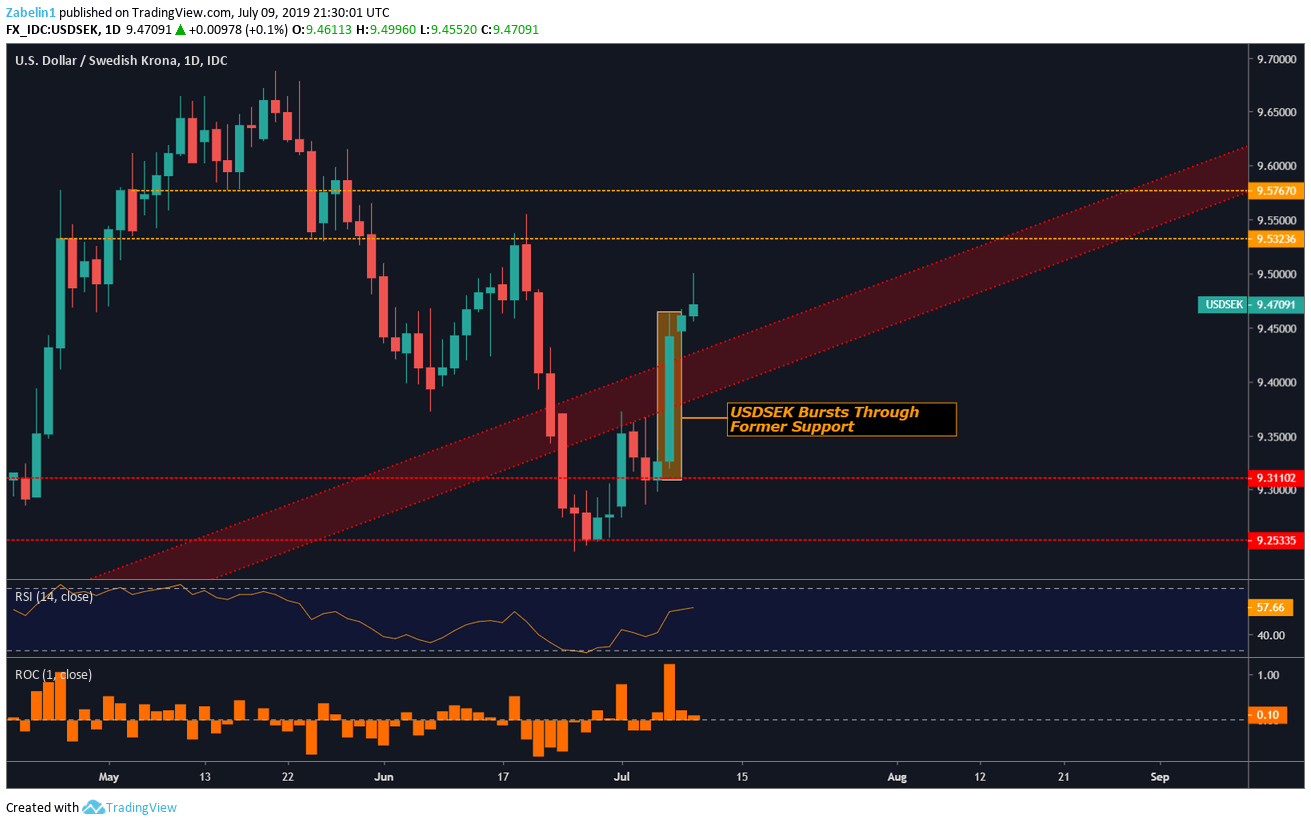
Buyers’ enthusiasm may be curbed as the pair approaches the lower lip of the 9.5323-9.5767 resistance zone, a former congestive range (yellow dotted lines). A pullback could see the pair re-testing rising support, though the juncture between the two will force traders to put their money where their mouths are and decide whether the trajectory is still supported by bullish bias. The fundamental outlook suggests there are tailwinds for the pair.
USDSEK Upward Trajectory Remains Strong

WILL NOKSEK’S CONGESTION BE SNEEZED OUT SOON?
After breaking below 5-month rising support, NOKSEK has been mostly trading in the 1.0836-1.0900 range as traders re-assess the overall trajectory. Zooming out to a monthly chart shows a continuation pattern known as a Symmetrical Triangle. The downtrend preceding the formation of this model suggests the pair will capitulate and break lower, eroding the gains gleaned from the 5-month uptrend.
Fundamental Factors Point to a Bearish Capitulation

SWEDISH KRONA, NORWEGIAN KRONE TRADING RESOURCES
- Join a freewebinar and have your trading questions answered
- Just getting started? See our beginners’ guide for FX traders
- Having trouble with your strategy? Here’s the #1 mistake that traders make
--- Written by Dimitri Zabelin, Jr Currency Analyst for DailyFX.com
To contact Dimitri, use the comments section below or @ZabelinDimitri on Twitter


