


NORDIC FX, NOK, SEK WEEKLY OUTLOOK
- USDSEK is re-testing critical rising support
- NOKSEK, USDNOK trading sideways for now
- USDNOK, USDSEK pairs likely to resume uptrend
See our free guide to learn how to use economic news in your trading strategy !
USDSEK CHART ANALYSIS
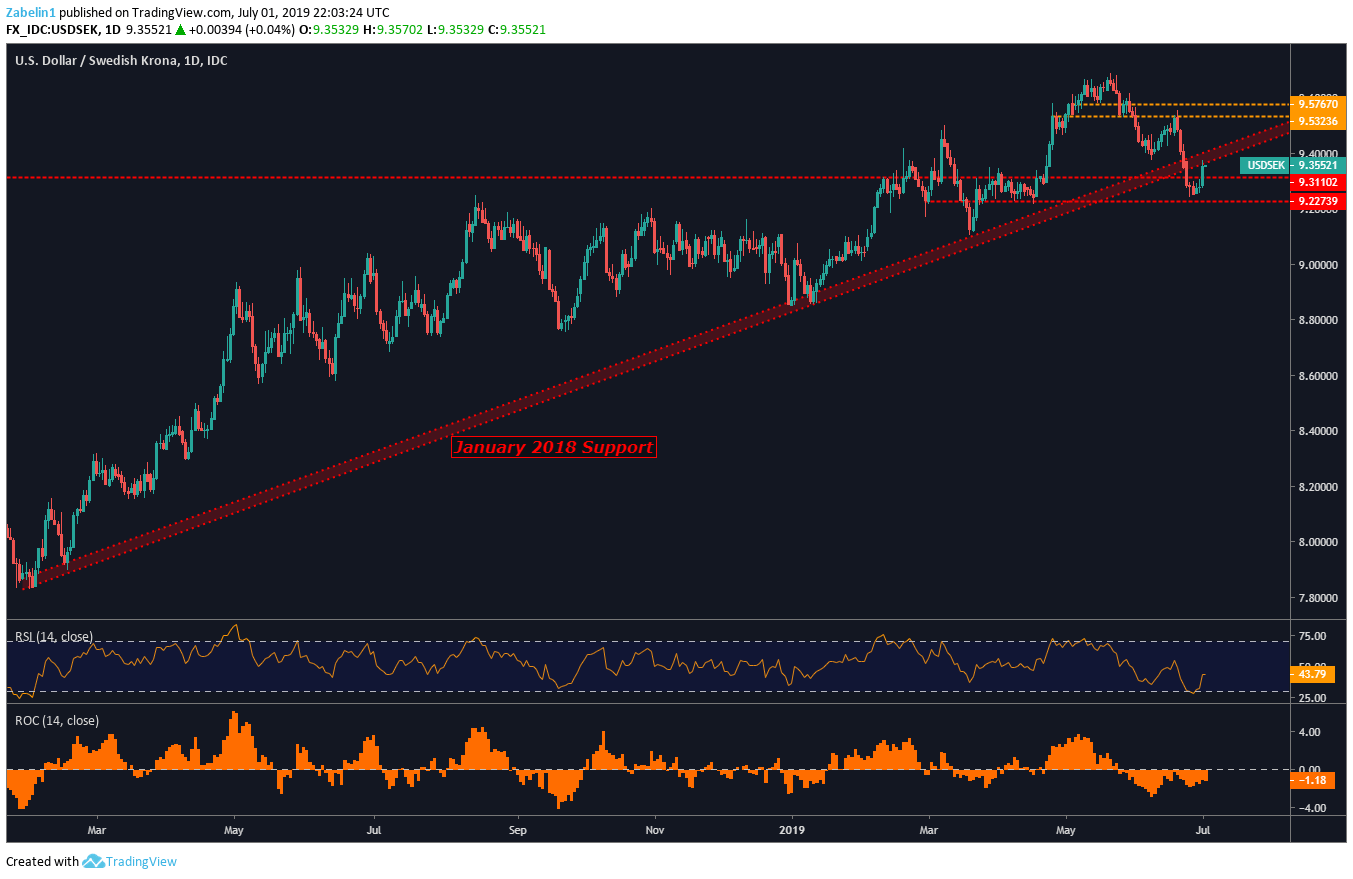
After trading above 17-year highs, USDSEK quickly retreated and the move was accelerated by a significant selloff in the US Dollar amid a surge of rate cut expectations from the Fed. During its descent, the pair broke through critical 17-month rising support (red parallel channel) and re-entered the March-April congestive range.
USDSEK Re-Tests Critical Rising Support

Zooming out, the pair has been on a steady incline for quite some time, and the deviation from the uptrend was likely just a fluke. The objective for the pair this week will be to re-enter the channel and close above it with follow through. The next barrier will then likely be at the 9.5323-9.5767 range (orange dotted lines).
USDSEK – Daily Chart
USDNOK TECHNICAL ANALYSIS
Until recently, for 15-months USDNOK has been steadily climbing up a rising support channel (red parallel channel). The over-1 percent drop marked a significant deviation for the pair, though the upward bias appears to be already showing itself. The pair is now trading within a familiar congestive range that it has traded within since November 2018 (yellow dotted lines).
USDNOK Catches its Breathe After Ground-Breaking Drop Through Critical Support

From a wider perspective, much like USDSEK, USDNOK’s deviation from the dominant uptrend – while greater in magnitude relative to the former pair – is a blip from what appears to be a firm resolve to continue higher. The fundamental outlook suggests the upward trajectory will continue, though it is unclear whether it will resume the previous incline at that particular slope.
USDNOK Uptrend Remains Strong Despite Deviation

NOKSEK EXCHANGE RATE ANALYSIS
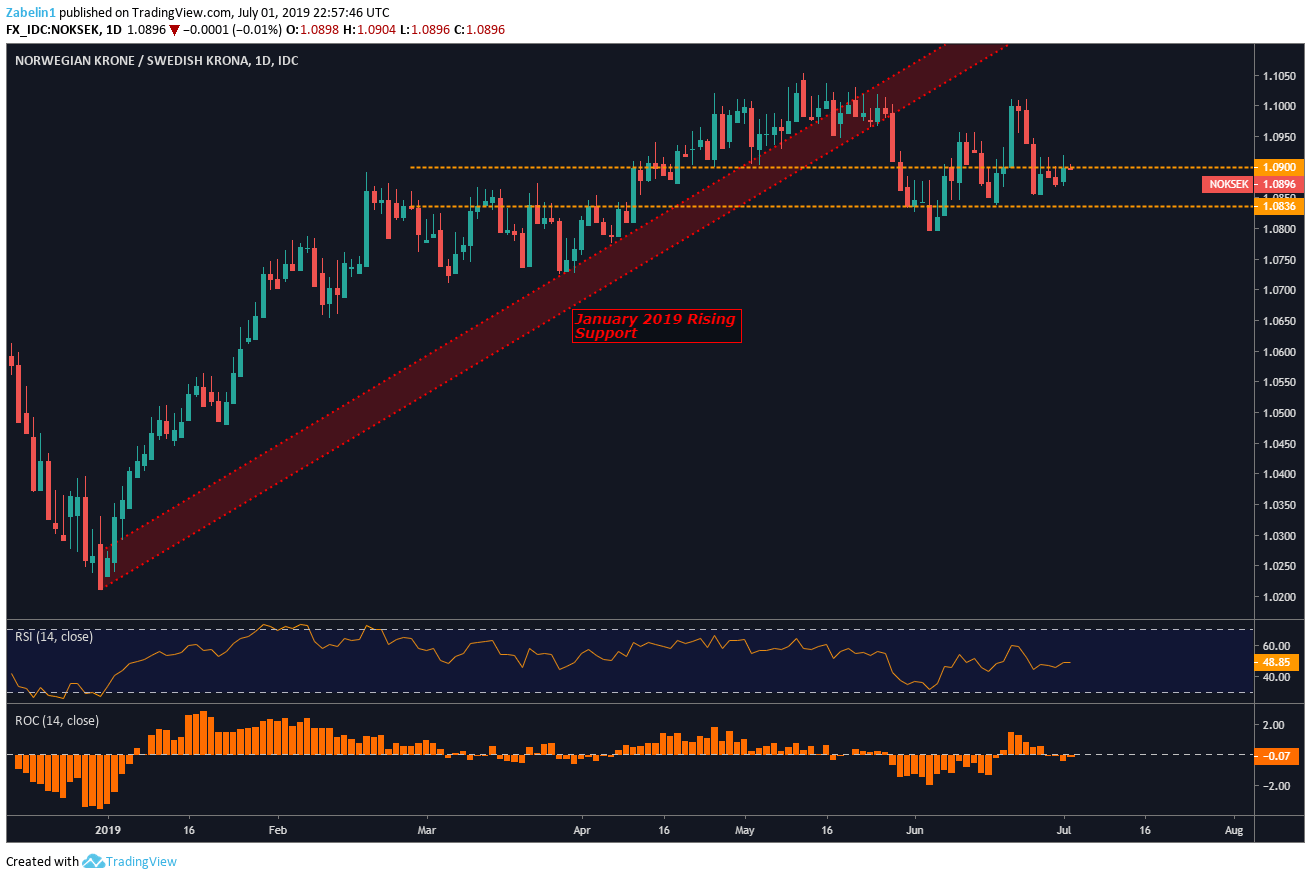
Since January 2019, NOKSEK comfortably climbed along a 5-month uptrend (red parallel channel) until it broke through support at the end of May. Since the breakthrough, NOKSEK has been trading in a familiar range as traders catch their breath and contemplate the future trajectory. The fundamental outlook suggests NOKSEK will capitulate and break below the lower lip of the range. But maybe not this week.
NOKSEK – Daily Chart
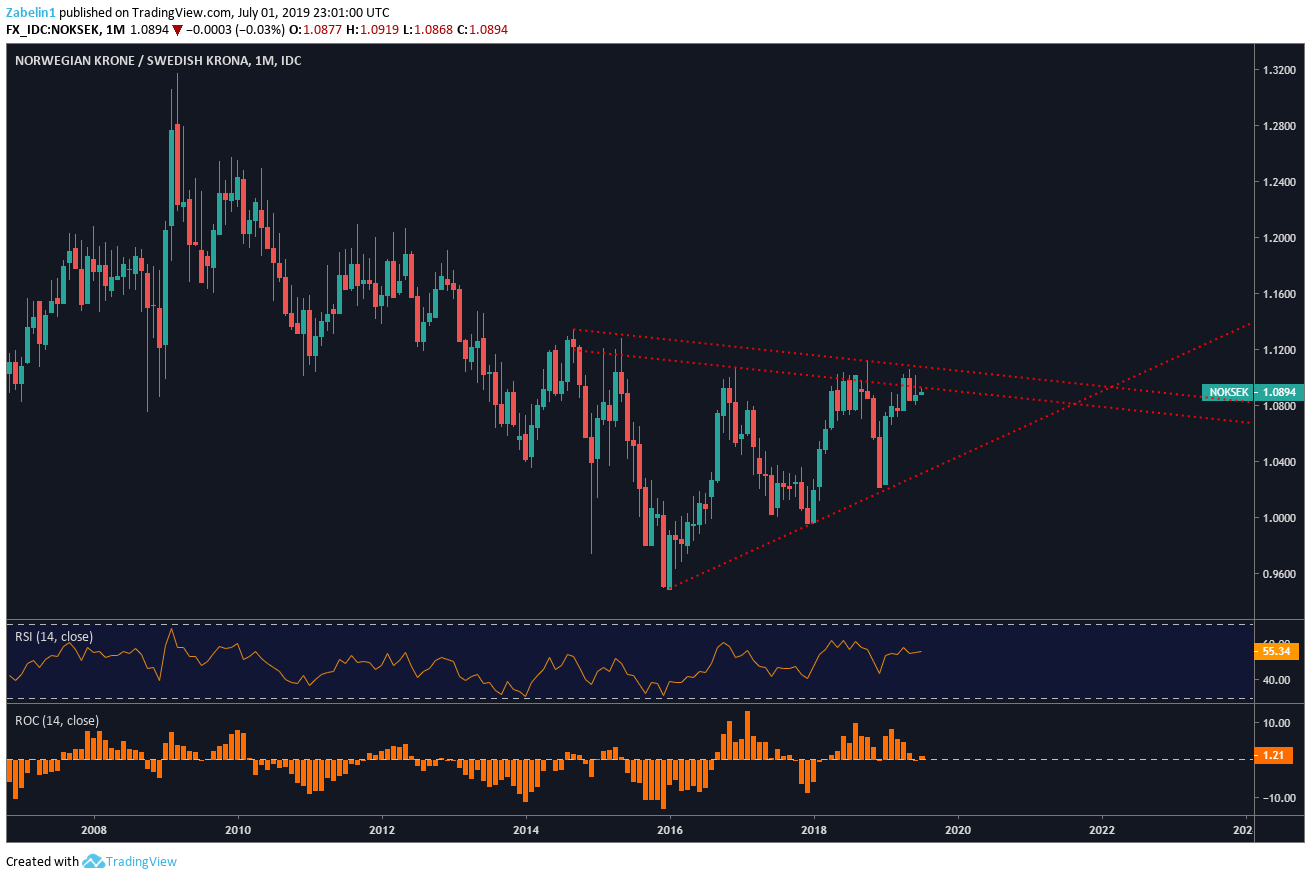
Zooming out to a monthly chart shows the pair is forming what appears to be a continuation pattern known as a Symmetrical Triangle. Given the preceding downtrend, it is supportive of the notion that the pair will break lower against a fundamental backdrop that is supportive of a bearish capitulation.
NOKSEK – Monthly Chart
SWEDISH KRONA, NORWEGIAN KRONE TRADING RESOURCES
- Join a freewebinar and have your trading questions answered
- Just getting started? See our beginners’ guide for FX traders
- Having trouble with your strategy? Here’s the #1 mistake that traders make
--- Written by Dimitri Zabelin, Jr Currency Analyst for DailyFX.com
To contact Dimitri, use the comments section below or @ZabelinDimitri on Twitter


