


BHP Group, ASX 200 Talking Points
- BHP Group Ltd shares hinting of a downtrend to come in ASX 200
- Australia at risk to US-China trade war knock-on economic impact
- ASX 200 approaching rising trend line support, eyeing 6203 ahead
Find out what retail traders’ equities buy and sell decisions say about the coming price trend!
ASX 200 May Fall as BHP Group Shares Hint Reversal
Australia’s benchmark ASX 200 could be at risk to a major reversal in the medium-term as a key sector of the index wobbles. On the immediate chart below, there appears to be a Head and Shoulders bearish reversal candlestick pattern brewing in BHP Group Ltd shares. BHP is an Australian company with the largest market cap (76.84b) of diversified metals & mining stocks.
Falling under the subsector of materials, these companies make up a combined 18.54% weight in the ASX 200. This is the second-largest next to financials which are roughly 32% of the index. As such, strong coordinated movements in these shares can drive Australia’s benchmark stock index, especially during times of aggressive risk aversion.
BHP Technical Analysis
Taking a closer look at BHP shares, the neckline of the Head and Shoulders appears to sit around 36.43. By taking the difference between the head (40.13) and neckline, we arrive at a breakout target just above 32.62. This area acted as support back in January before the stock climbed. Meanwhile, the rising support line from November 2018 is also at risk to breaking down.
BHP Group Daily Chart
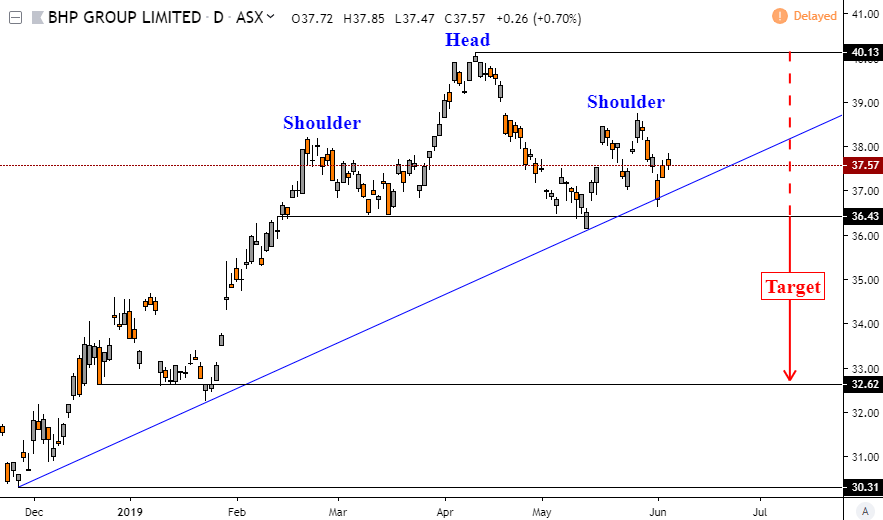
Chart Created in TradingView
Shares of BHP are struggling to make a direction given that US-China trade war fears and dovish RBA monetary policy expectations are competing for fundamental influences. The former is “risk-negative”, especially given that China is Australia’s largest trading partner. An escalation in trade wars that damages both economies can have knock-on impacts for Australia.
This is a series vulnerability for not just the ASX 200, but to equities in general. As the US looks to potentially launching a new trade war front with Mexico, Beijing has been loading up its ammunition in the event of escalation. Meanwhile, it is unclear yet at this point if the Fed will cut rates as it weighs the economic consequences of a trade war against incoming data.
ASX 200 Technical Analysis
Now looking at the ASX 200 daily chart, the index is coming up on what could potentially be a rising support line from February (pink line below). A break under followed by taking out 6203 opens the door to reversing the dominant uptrend which was initiated by a bullish Head and Shoulders back in January. Despite fundamental resilience, the index seems to be at a turning point.
ASX 200 Daily Chart
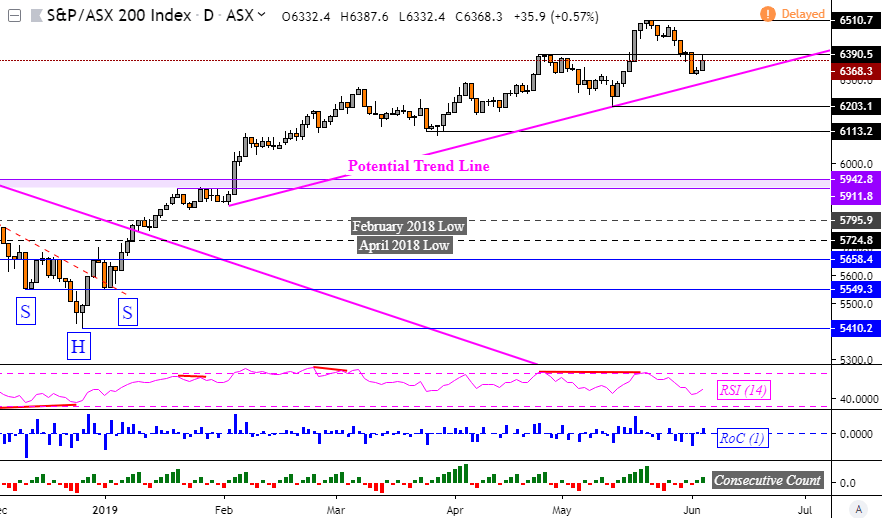
Chart Created in TradingView
FX Trading Resources
- See how equities are viewed by the trading community at the DailyFX Sentiment Page
- Just getting started? See our beginners’ guide for FX traders
- Having trouble with your strategy? Here’s the #1 mistake that traders make
--- Written by Daniel Dubrovsky, Currency Analyst for DailyFX.com
To contact Daniel, use the comments section below or @ddubrovskyFX on Twitter


