


GOOG/FAANG/NDX Highlights:
- GOOGL “hole-in-the-wall” gap similar to FB last year
- Doesn’t necessarily mean a market top now, but it’s a sign of deterioration
- So goes FAANG goes the NDX goes the whole market
To see what fundamental drivers and technical signposts DailyFX analysts are watching, check out the Q2 forecasts for the Dollar, Euro, and Pound on the DailyFX Trading Guides page.
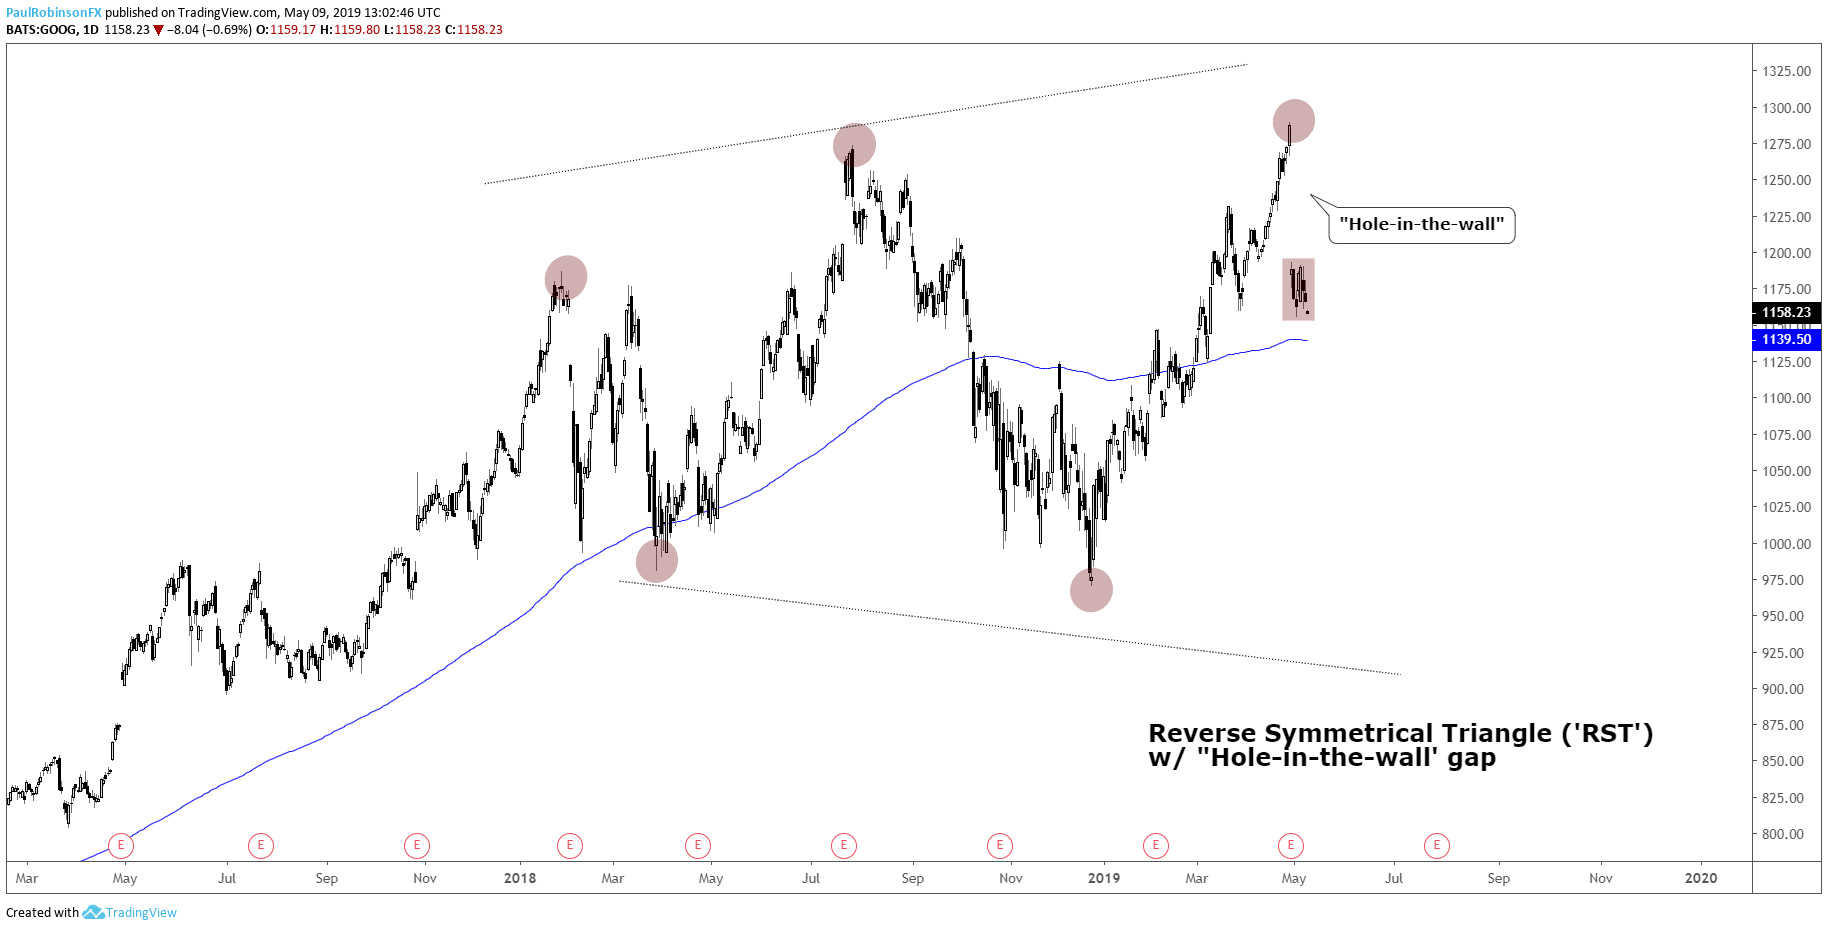
GOOG “hole-in-the-wall” gap similar to FB last year
Last week, Alphabet (Google, GOOG) reported earnings and was blasted by nearly 8% the day after closing to a new record high. This type of powerful gap from a long-term high (or all-time high in this case) is referred to as a “hole-in-the-wall”. These are known to be markers of major tops as the crowd is clearly and suddenly caught leaning the wrong way.
A somewhat recent example is Facebook (FB) last year in July, when it gapped lower from a record high by an even fiercer 20% on earnings disappointment. The Nasdaq 100 and stocks in general rose another two months before reaching a peak in September, but it was a sign that one of the bull market darlings in the notorious FAANG group had lost its leadership (FAANG = FB, AAPL, AMZN, NFLX, GOOG). To review, check out this piece from September – ‘Nasdaq 100, FAANG Charts and What They Could Mean for the Whole Market’.
Further adding to GOOG’s technical difficulties is the long-term topping potential it has built up since January 2018. A Reverse Symmetrical Triangle (‘RST’) pattern is developing. It’s a formation marked by higher highs and lower lows in expanding fashion, highlighting growing uncertainty. It’s a massive pattern and when you couple it with the sharp gap, Google could be one giant missed step closer to cementing a long-term top.
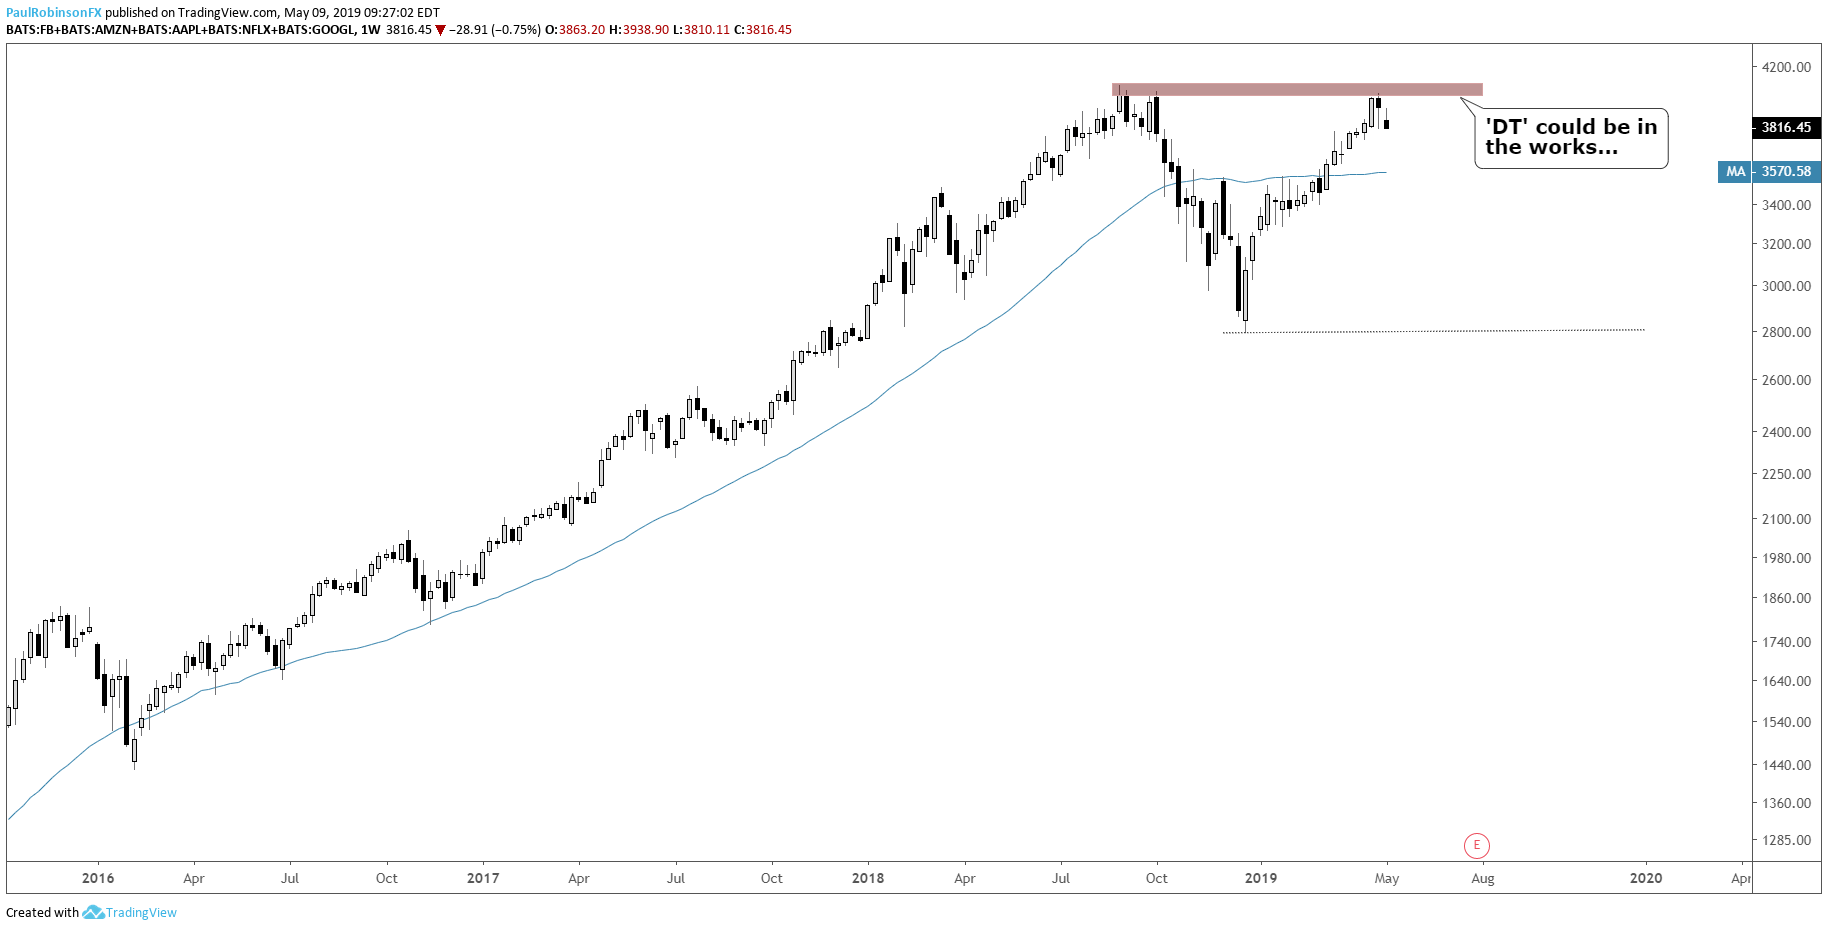
FAANG could be double-topping with the price of the group trading around the prior record high. This of course could have dire implications for the Nasdaq 100, and since this group of stocks are the ‘bull market darlings’, a top would obviously not bode well for the broader market.
Check out this extensive piece on the history of major financial bubbles and compare how FAANG and the current stock market environment may indeed fit the mold of the past.
GOOG Daily Chart (‘RST’ pattern, ‘hole-in-the-wall’ gap)
FAANG Weekly Chart (Double-top?)
So goes FAANG goes the NDX goes the whole market
If the market hasn’t already made a turn recently, keep an eye on GOOG and whether it can gain any traction or not. FB failed to do so last year and FAANG in general was sluggish as the NDX pushed to new record highs. Persistent divergence in the weeks ahead between GOOG, FAANG and the broader indices could end up being the same canary in the coal mine that FB was from July to September.
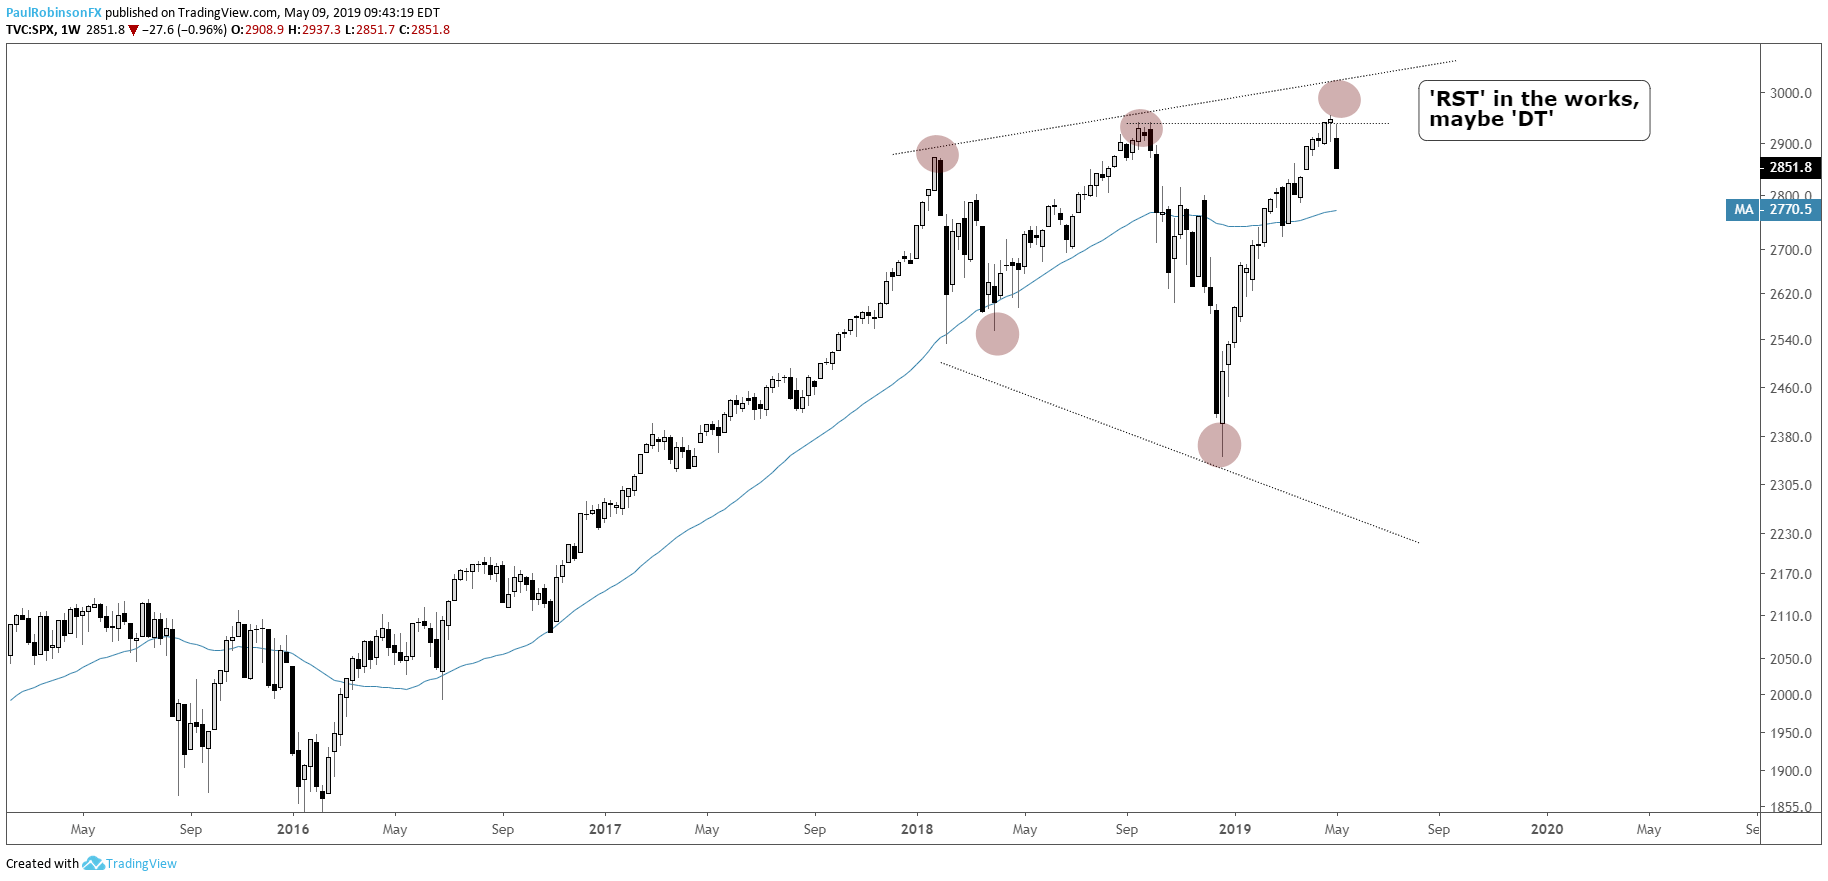
Looking at the broader market we also have similar broadening patterns as the one in Google, with the price swings since January 2018 growing in size. If the S&P ends up trading higher, keep an eye on the 3k level as not only is a big psych-level but a top-side trend-line of a Reverse Symmetrical Triangle (‘RST’) formation lies up there as well. These patterns with their large swings in price, again, mark uncertainty in the marketplace. If the market just topped recently on the wedge break, then we could be getting a double-top underway.
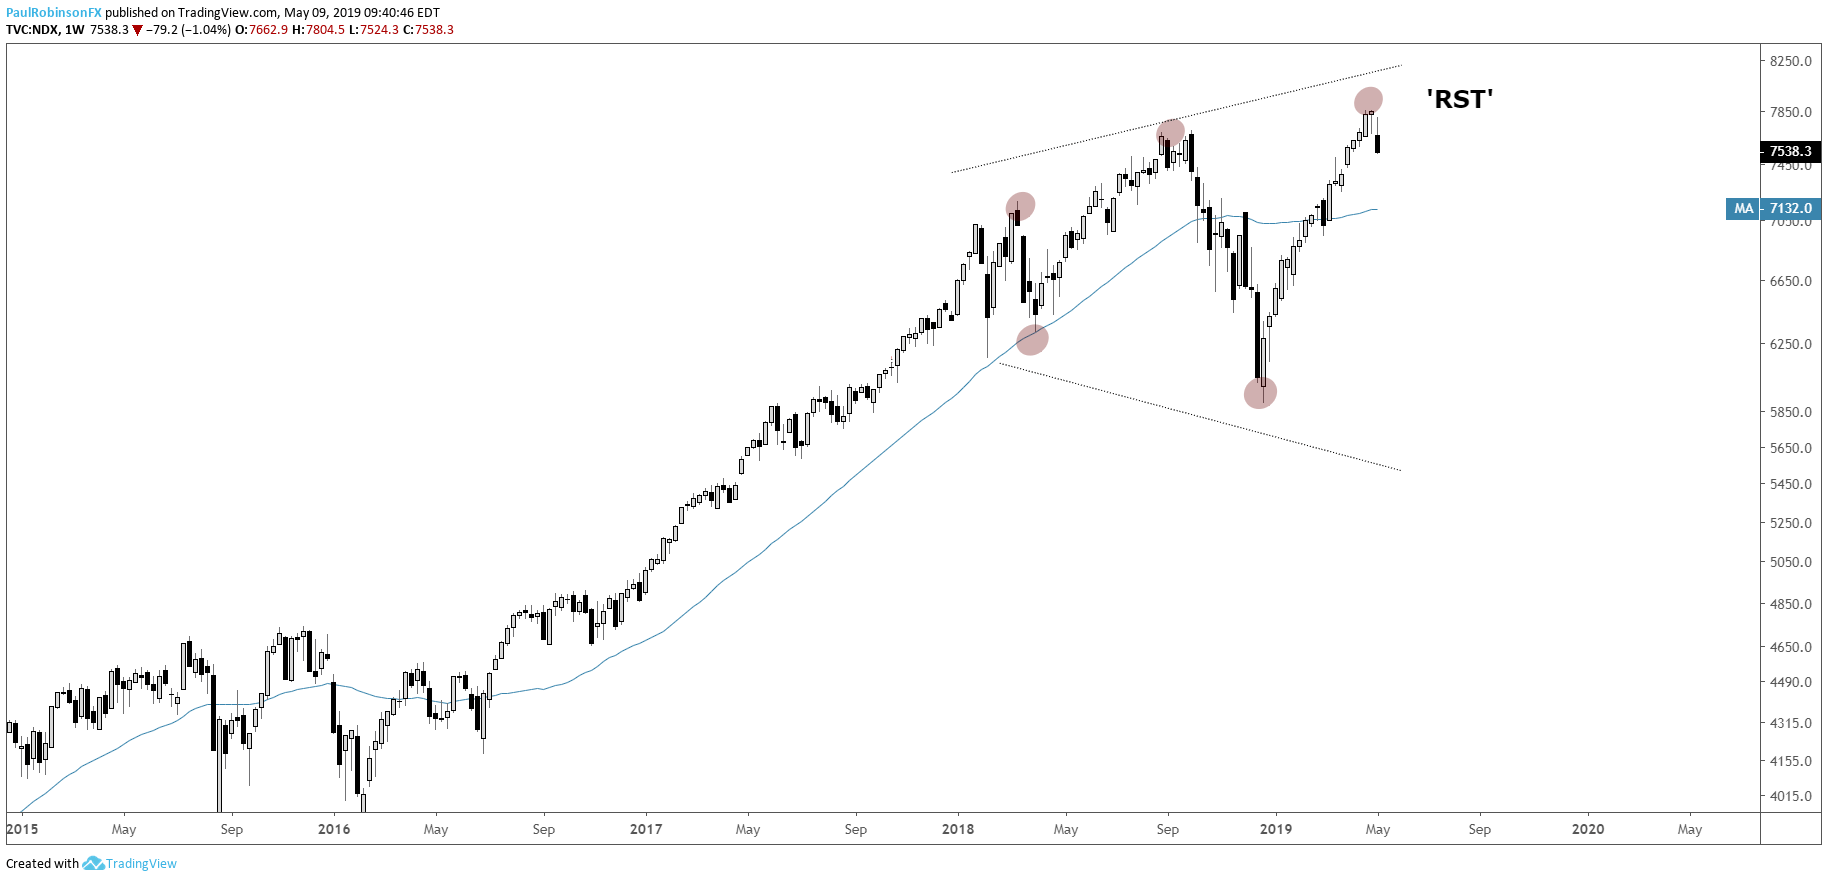
The Nasdaq 100 already has the higher-high to provide the final piece of the ‘RST’ pattern. A big topping process since the beginning of 2018 could indeed be drawing us closer to the end of the bull…
Nasdaq 100 Weekly Chart (‘RST’ Pattern)
S&P 500 Weekly Chart ('RST' or 'DT' topping potential)
Forex & CFD Trader Resources
Whether you are a new or experienced trader, we have several resources available to help you; indicator for tracking trader sentiment, quarterly trading forecasts, analytical and educational webinars held daily, trading guides to help you improve trading performance, and one specifically for those who are new to forex.
---Written by Paul Robinson, Market Analyst
You can follow Paul on Twitter at @PaulRobinsonFX


