


Dow Jones Talking Points:
- US stocks continue to rally after last week’s bounce from support. In the Dow Jones, buyers came back after a support test around the 25,000 psychological level and prices are now trading at fresh six-month highs. This keeps the door open for bullish continuation, although prices have stretched rather far from nearby support.
- Traders looking at bullish continuation in the Dow can look for support based on how aggressively they want to approach the move. For those with shorter-term strategies or for those looking to be a bit more aggressive, there’s potential support around 25,695 and 25,500; while those looking to move forward a bit more conservatively would likely want to wait for a deeper pullback in order to allow for more cogent risk management.
- DailyFX Forecasts on a variety of currencies such as the US Dollar or the Euro are available from the DailyFX Trading Guides page. If you’re looking to improve your trading approach, check out Traits of Successful Traders. And if you’re looking for an introductory primer to the Forex market, check out our New to FX Guide.
Do you want to see how retail traders are currently trading the US Dollar? Check out our IG Client Sentiment Indicator.
Dow Jones to Fresh Six-Month Highs After Last Week’s Support Test
Bullish enthusiasm continues to show in US stocks, and American indices remain with strong themes after last week saw a return of buyers. In the Dow Jones Industrial Average, the prior pullback lasted for a little over a week as prices dipped from 25,695 down for a support test at the psychological 25,000 level. This was the third zone of support we had looked at over the prior couple of weeks, and when buyers came back at 25,000, the retracement was soon completed and bulls took over to help prices re-ascend up to fresh near-term highs.
At this point, the Dow is trading through the late-February swing high to produce a fresh six-month high in the index.
Dow Jones Daily Price Chart: Fresh Six-Month Highs After Last Week’s Support Test

Chart prepared by James Stanley
At this stage, the complication is one of entry as prices have moved quite a ways from nearby support, looking at the swing from last week. And it could be difficult to justify an 800+ point stop on a move that’s already seen price action perch up to fresh highs.
Moving forward, traders can look for support based on how aggressively they want to approach this move in the Dow. For those using shorter-term strategies, or for those that really want to focus on continuation of this bullish trend, near-term support could be sought out at the prior swing-high of 25,685; or a bit deeper we have another area of interest around 25,500, as this provided a short-term swing-low on Friday and it syncs up fairly well with a group of prior swing highs.
Dow Jones Four-Hour Price Chart
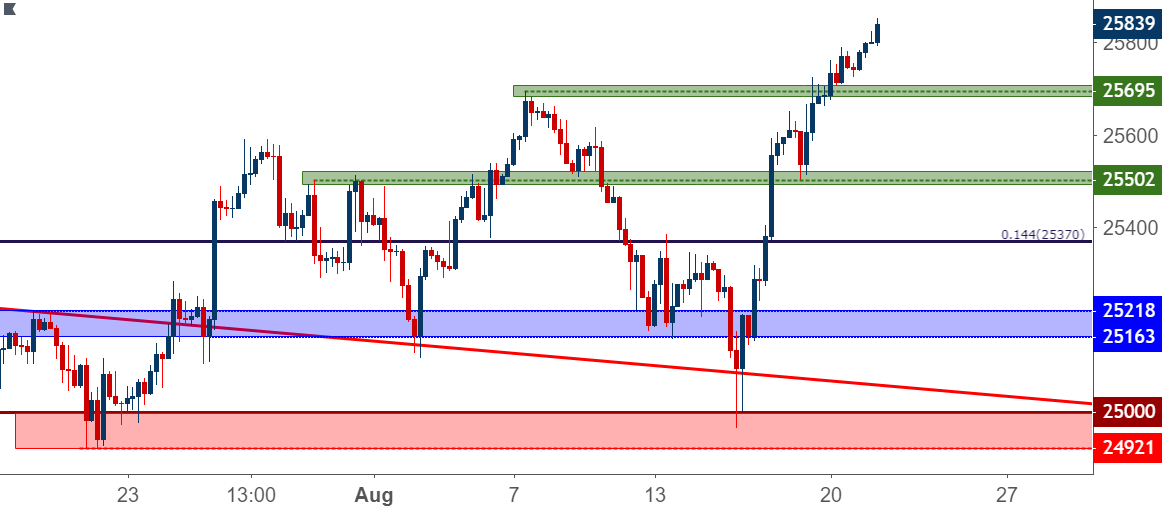
Chart prepared by James Stanley
For those that want to take a longer-term approach towards the matter, or for those looking to be a bit more conservative with additional top-side re-entries, deeper support could be sought out at the 14.4% Fibonacci retracement of the post-Election move. This takes place around 25,370, and this is a level we’ve used on a couple of recent occasions as both resistance in June, and short-term support in July.
Dow Jones Daily Price Chart
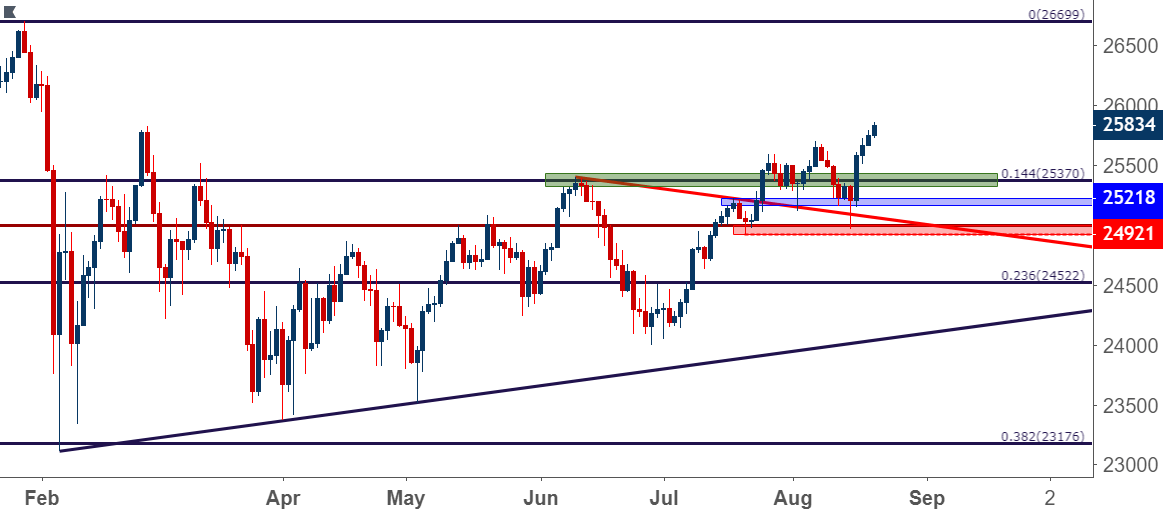
Chart prepared by James Stanley
To read more:
Are you looking for longer-term analysis on the U.S. Dollar? Our DailyFX Forecasts for Q3 have a section for each major currency, and we also offer a plethora of resources on USD-pairs such as EUR/USD, GBP/USD, USD/JPY, AUD/USD. Traders can also stay up with near-term positioning via our IG Client Sentiment Indicator.
Forex Trading Resources
DailyFX offers a plethora of tools, indicators and resources to help traders. For those looking for trading ideas, our IG Client Sentiment shows the positioning of retail traders with actual live trades and positions. Our trading guides bring our DailyFX Quarterly Forecasts and our Top Trading Opportunities; and our real-time news feed has intra-day interactions from the DailyFX team. And if you’re looking for real-time analysis, our DailyFX Webinars offer numerous sessions each week in which you can see how and why we’re looking at what we’re looking at.
If you’re looking for educational information, our New to FX guide is there to help new(er) traders while our Traits of Successful Traders research is built to help sharpen the skill set by focusing on risk and trade management.
--- Written by James Stanley, Strategist for DailyFX.com
Contact and follow James on Twitter: @JStanleyFX


