


Dow Jones Talking Points:
- The Dow Jones Industrial Average is jumping after a support test at the psychological level of 25,000 yesterday morning. This was the third area of support we looked at over the past week, but prices have quickly jumped back-up to fresh short-term highs, suggesting that the recent retracement has completed and the door remains open for bullish continuation strategies in the index.
- The big question around the Dow Jones and, bigger-picture, US equity indices is whether we see another push up to towards highs set earlier in the year. In the Dow, a number of resistance levels remain should a deeper push to fresh yearly highs continue in the weeks ahead.
- DailyFX Forecasts are available from the DailyFX Trading Guides page. If you’re looking to improve your trading approach, check out Traits of Successful Traders. And if you’re looking for an introductory primer to the Forex market, check out our New to FX Guide.
Do you want to see how retail traders are currently trading the US Dollar? Check out our IG Client Sentiment Indicator.
Dow Jones Jumps After Support Test at 25,000
US stocks are getting back to their bullish ways after a retracement drove pullbacks across American indices over the past week. After setting a fresh five-month high just a week-and-a-half ago a retracement started to develop that pushed the Dow Jones Industrial Average through multiple short-term supports. We’d previously looked at prices posing another test of the ‘s2’ zone we had looked at a couple of weeks ago, and as we warned, a deeper retracement may follow as price action was finding resistance at old support.
That deeper retracement took place as Tuesday price action led into a deeper decline on Wednesday morning. The Dow Jones Industrial Average found support at the zone we’d looked at that populated around the 25,000 psychological level, and bulls have been off to the races ever since, pushing prices up to a fresh short-term high.
Dow Jones Two-Hour Price Chart: Aggressive Bounce from 25K Support
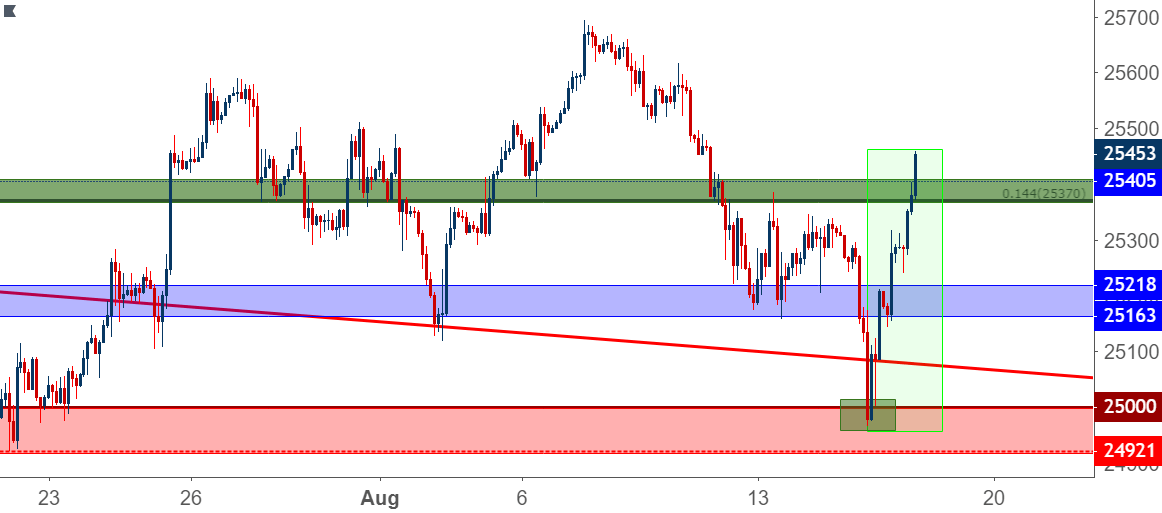
Chart prepared by James Stanley
With short-term price action pushing up to fresh near-term highs, the door would appear open for bullish continuation as the prior retracement appears complete. At this stage, traders can scroll down to an hourly chart to look for shorter-term support levels that can keep the door open for bullish continuation strategies. We’d previously looked at support in the area around the 14.4% Fibonacci retracement of the post-Election move, and that’s at 25,370, and this can be connected to a group of swing highs from Tuesday to form a zone of potential support.
Below that, we have the same ‘s2’ zone that we’d previously looked at that runs from the approximate 25,163 up to 25,218, and below that we have the most recent area of support from the 25k psychological level.
Dow Jones Hourly Price Chart: Fresh Short-Term Highs Opens Door for Bullish Continuation

Chart prepared by James Stanley
On the target side of bullish plays in the Dow, the big question is whether we can push up to fresh five-month highs. That turn last week took place around 25,695, and just above that we have the February swing-high at 25,825. If we’re able to take out those two levels, potential resistance remains around 25,944 and again just above the 26k level at 26,064.
Dow Jones Daily Price Chart
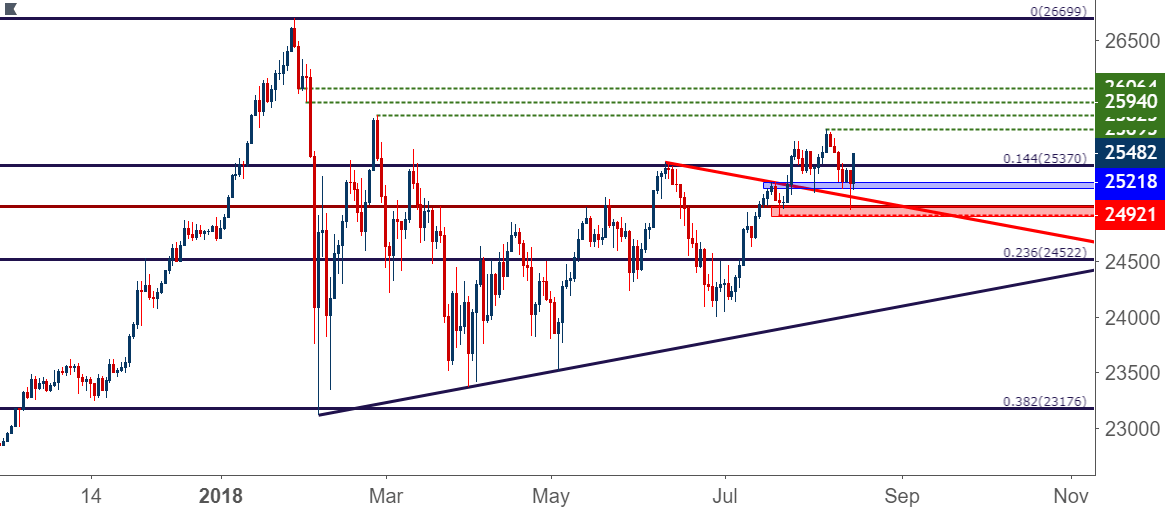
Chart prepared by James Stanley
To read more:
Are you looking for longer-term analysis on the U.S. Dollar? Our DailyFX Forecasts for Q1 have a section for each major currency, and we also offer a plethora of resources on USD-pairs such as EUR/USD, GBP/USD, USD/JPY, AUD/USD. Traders can also stay up with near-term positioning via our IG Client Sentiment Indicator.
Forex Trading Resources
DailyFX offers a plethora of tools, indicators and resources to help traders. For those looking for trading ideas, our IG Client Sentiment shows the positioning of retail traders with actual live trades and positions. Our trading guides bring our DailyFX Quarterly Forecasts and our Top Trading Opportunities; and our real-time news feed has intra-day interactions from the DailyFX team. And if you’re looking for real-time analysis, our DailyFX Webinars offer numerous sessions each week in which you can see how and why we’re looking at what we’re looking at.
If you’re looking for educational information, our New to FX guide is there to help new(er) traders while our Traits of Successful Traders research is built to help sharpen the skill set by focusing on risk and trade management.
--- Written by James Stanley, Strategist for DailyFX.com
Contact and follow James on Twitter: @JStanleyFX


