


Talking Points:
- US Stocks have rallied to kick off Q3, and this has helped to drive the Dow Jones Industrial Average up to monthly highs, and prices are currently resisting around the 14.4% Fibonacci retracement of the April-June bullish move.
- The next couple of days bring a potentially large driver to markets with the two-day Humphrey Hawkins testimony from FOMC Chair Jerome Powell on Capitol Hill. Today at 10 AM ET, Mr. Powell testifies in front of the Senate Finance Committee, and tomorrow he speaks in front of the House Financial Services Committee. This can provide volatility across US assets including equities, bonds and the US Dollar.
- DailyFX Forecasts are available from the DailyFX Trading Guides page. If you’re looking to improve your trading approach, check out Traits of Successful Traders. And if you’re looking for an introductory primer to the Forex market, check out our New to FX Guide.
Do you want to see how retail traders are currently trading the US Dollar? Check out our IG Client Sentiment Indicator.
Dow Runs into Fibonacci Resistance at Test of Monthly Highs
US stocks have continued their Q3 rally, and the Dow Jones Industrial Average is currently in the process of testing monthly highs above the 25,000 psychological level. Last week we had looked at the prospect of bullish trend continuation after prices had pulled back to a key support zone, and prices rose through both targets of 24,921 and 25,000. We’re currently seeing a bit of resistance show at the 14.4% Fibonacci retracement of the April-June bullish move.
Dow Jones Four-Hour Price Chart: Resistance at 14.4% Retracement of April-June Major Move

Chart prepared by James Stanley
We’ve now seen a couple of tests of that resistance area already on the new week, and this would exude caution for continuation as buyers have yet to show the ability to push prices up to fresh highs. Also of consideration is the fact that we’re nearing two days of testimony from FOMC Chair Jerome Powell as part of the bank’s twice-a-year Humphrey Hawkins testimony, and traders may want to wait for a cleaner setup before looking to take on exposure.
Taking a step back, we can highlight yesterday’s Doji at resistance, and this is yet another reason to be cautious of chasing topside trends ahead of a really big upcoming driver. This can also expose a couple of potential support levels that could make bullish strategies more attractive, driven by the prospect of a pullback combined with a continuation of higher-lows. The 23.6% retracement of the April-June move rests at 24,921, and the 38.2% retracement of that same move comes in at 24,624. A display of support at either of these levels can re-open the door to bullish continuation, with the 23.6% marker being an aggressive point of re-entry while the 38.2% support would be a little less so.
If we do see a bearish break below the 50% retracement, we would also have a break of the bullish trend-line that held the lows as we traded into Q3, and this would bring question to the near-term bullish trend.
Dow Jones Daily Price Chart: Potential Pullback Levels for Bullish Continuation Strategies
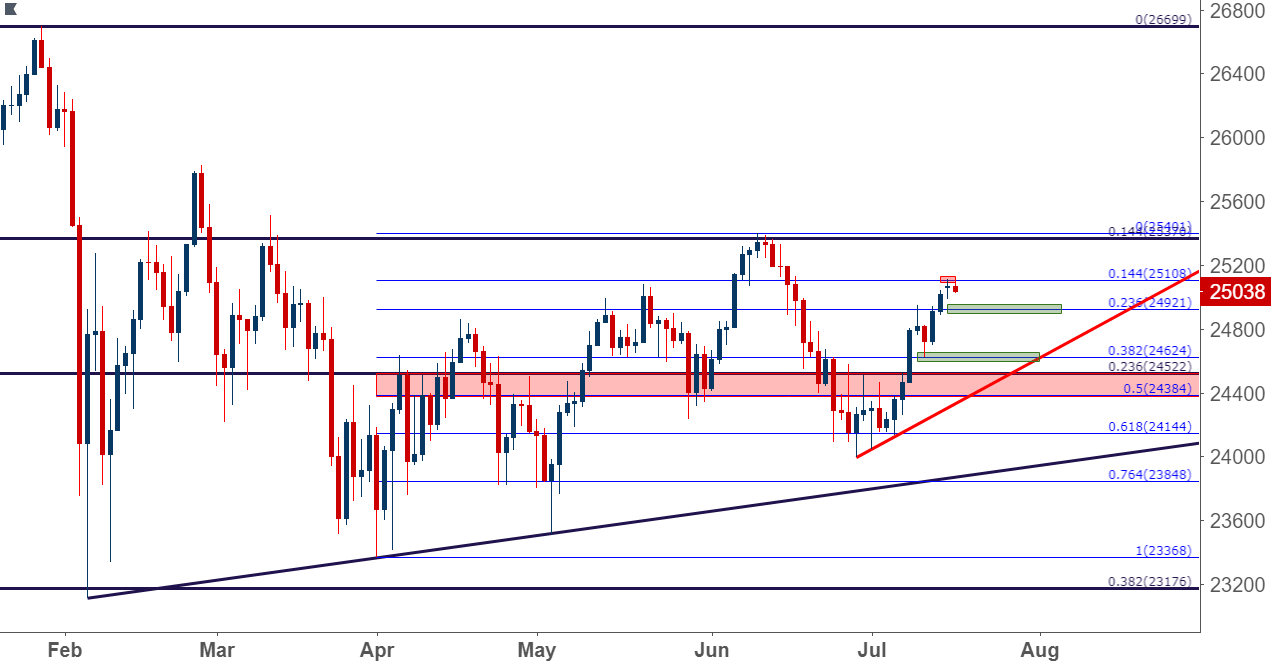
Chart prepared by James Stanley
To read more:
Are you looking for longer-term analysis on the U.S. Dollar? Our DailyFX Forecasts for Q1 have a section for each major currency, and we also offer a plethora of resources on USD-pairs such as EUR/USD, GBP/USD, USD/JPY, AUD/USD. Traders can also stay up with near-term positioning via our IG Client Sentiment Indicator.
Forex Trading Resources
DailyFX offers a plethora of tools, indicators and resources to help traders. For those looking for trading ideas, our IG Client Sentiment shows the positioning of retail traders with actual live trades and positions. Our trading guides bring our DailyFX Quarterly Forecasts and our Top Trading Opportunities; and our real-time news feed has intra-day interactions from the DailyFX team. And if you’re looking for real-time analysis, our DailyFX Webinars offer numerous sessions each week in which you can see how and why we’re looking at what we’re looking at.
If you’re looking for educational information, our New to FX guide is there to help new(er) traders while our Traits of Successful Traders research is built to help sharpen the skill set by focusing on risk and trade management.
--- Written by James Stanley, Strategist for DailyFX.com
Contact and follow James on Twitter: @JStanleyFX


