


Talking Points:
- The US Dollar has put in another failed attempt to scale-above the 95.00 level on DXY, and this happened shortly after the release of another very strong inflation report out of the United States. This week brings a potentially large US driver with FOMC Chair Jerome Powell’s Humphrey Hawkins testimony. Mr. Powell will speak in-front of the Senate Finance Committee tomorrow, followed by the House Financial Services Committee on Wednesday. This could provide drive to the US Dollar, US Stocks and a number of major currency pairs.
- While the US Dollar continues to seek out direction, EUR/USD may have just gotten a push in the bearish direction as last week brought in a near-term lower-low. Prices have bounced back into the key area of support/resistance that runs from 1.1685-1.1736, and if prices are able to hold this area in the early-portion of this week, the door could re-open to bearish strategies in EUR/USD on the basis of both a fresh lower-low and a new lower-high.
- DailyFX Forecasts on a variety of currencies such as the US Dollar or the Euro are available from the DailyFX Trading Guides page. If you’re looking to improve your trading approach, check out Traits of Successful Traders. And if you’re looking for an introductory primer to the Forex market, check out our New to FX Guide.
Do you want to see how retail traders are currently trading the US Dollar? Check out our IG Client Sentiment Indicator.
US Dollar Continues Friday Reversal into New Week
Last week saw the US Dollar pose another test of the 95.00 level on DXY, and this was driven by another strong CPI print that was released on Thursday morning. Headline inflation came in at 2.9% for the month of June, and this was tenth consecutive month that inflation printed at-or-above the Fed’s target of 2%. This also puts the bank squarely on track for another two rate hikes this year as the prior two 2018 hikes have yet to temper inflation.
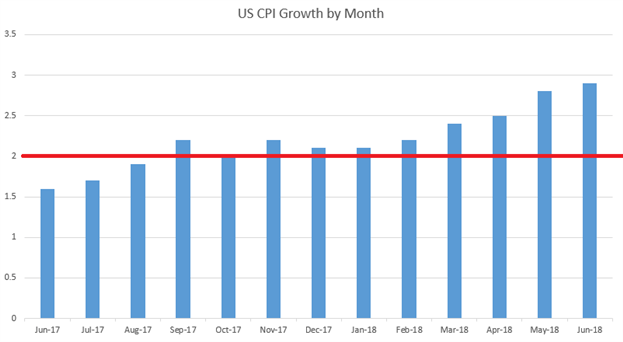
Chart prepared by James Stanley
The initial response in the US Dollar was one of strength, and in short-order DXY had climbed back-above the 95.00 level as we traded into the European session on Friday morning. But as the week moved towards close, prices pulled back and did not stop: The US Dollar closed on Friday very near where it had started on Thursday, before inflation data was released. And as we opened into this week, that pullback continued and the Dollar has dropped back-towards the zone of support that runs from 94.20-94.30.
US Dollar via ‘DXY’ Hourly Price Chart: Post-Inflation Ramp Erased
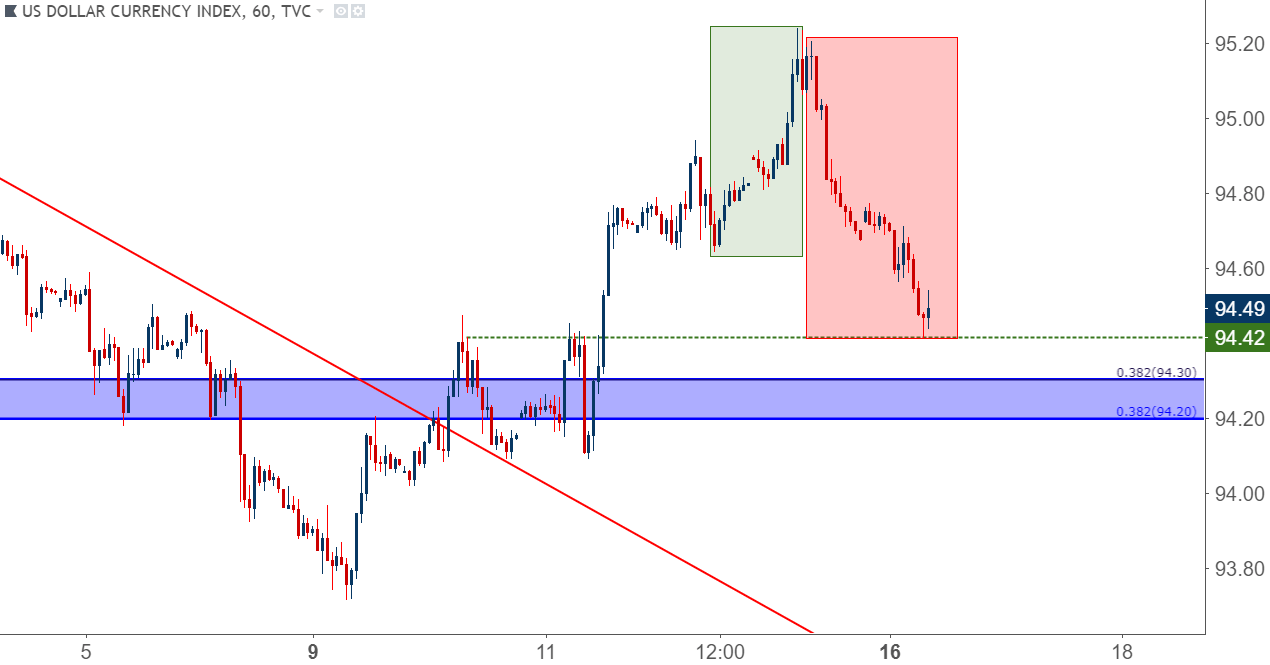
Chart prepared by James Stanley
Powell Testimony Highlights This Week’s Calendar
This week’s economic docket has a number of pertinent US items, and the early-portion of the week will likely be focused on FOMC Chair, Jerome Powell’s Humphrey Hawkins testimony on Capitol Hill. Chair Powell speaks to the Senate Finance Committee tomorrow, and on Wednesday he speaks in front of the House Financial Services Committee. These events are always interesting as the floor is wide-open for questions from representatives of Congress. While the Fed’s chairs goal is often one of maintaining the median-line, answering the representatives questions while not provoking too much volatility in markets, we do have some recent examples of reversals fueled by Humphrey Hawkins testimony. Notably, Chair Yellen’s performance in February of 2016 helped to quell a nasty sell-off in equities. In short order, stocks were flying-higher and that theme of strength largely lasted into the US Presidential election, at which point it went into overdrive.
DailyFX Economic Calendar: High-Impact Events, Week of July 16, 2018
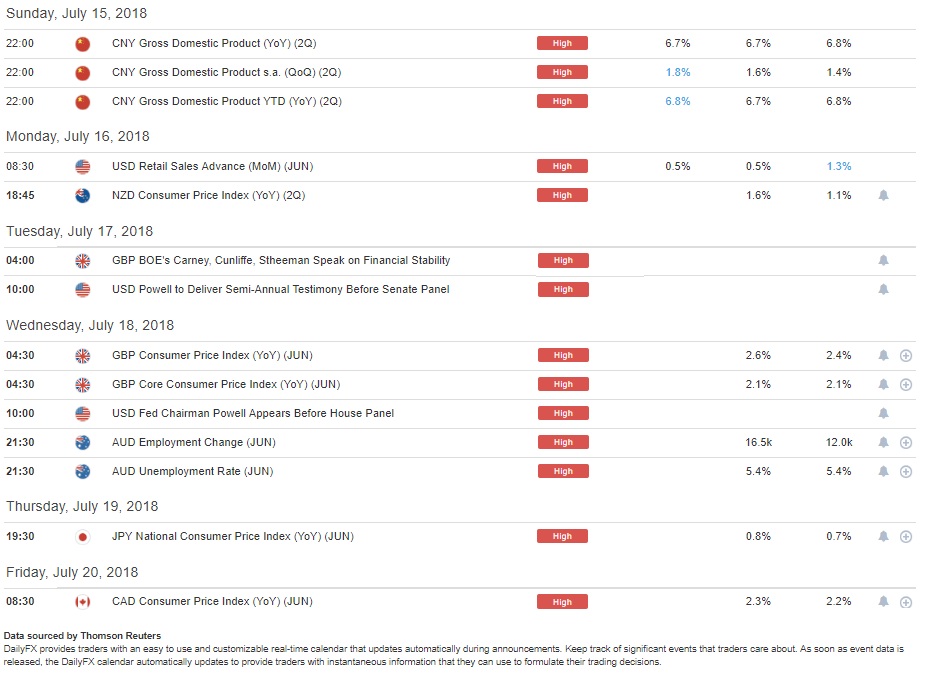
Chart prepared by James Stanley
US Dollar: Will the Q3 Slump Continue?
So far Q3 has been considerably less bullish for the US Dollar from what we saw last quarter. The level of 95.00 appears to be somewhat of a hindrance to US Dollar strength, as yet another attempt to climb-above this level on Friday has faltered.
With USD now pulling back, the big question is where/when buyer support might show up. We have a few areas of interest just underneath current price action. The confluent zone of Fibonacci support runs from 94.20-94.30, and a little lower at 93.71 we have the July swing-low. Below that, we have the June swing-low at 93.20-93.30. Each of these could make for interesting areas to investigate the prospects of a bullish reversal in USD short-term price action.
US Dollar Daily Price Chart
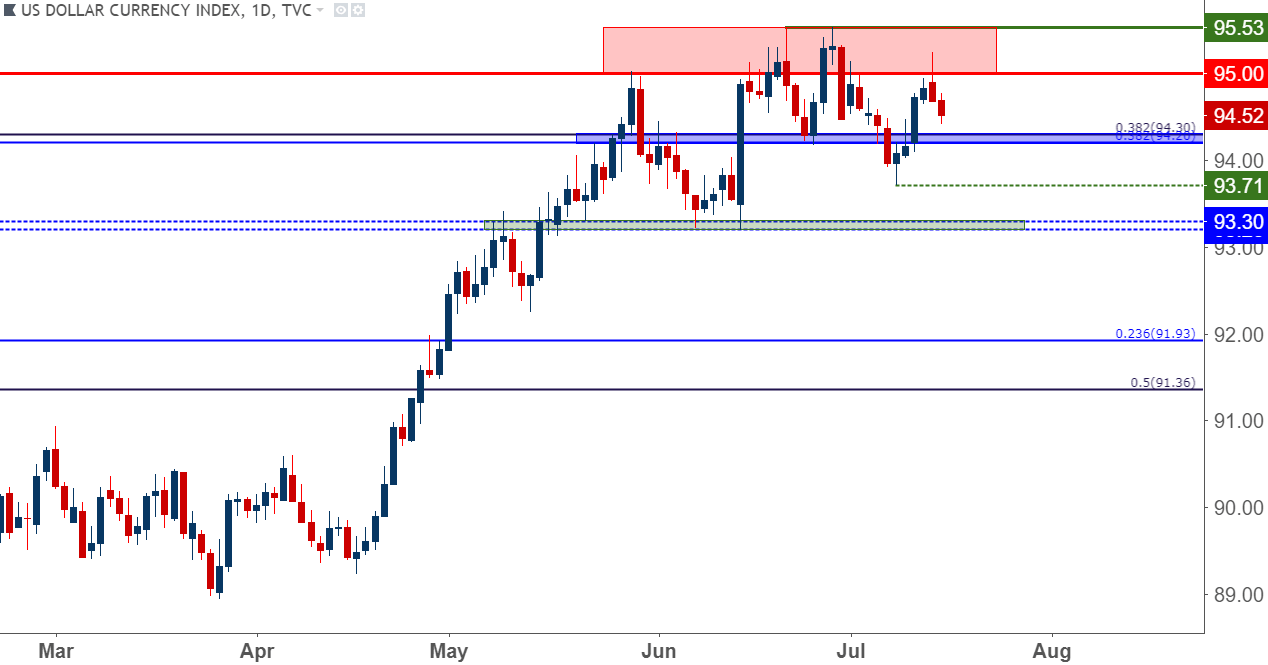
Chart prepared by James Stanley
EUR/USD Back into Key Zone
EUR/USD had started Q3 with a full head of steam, and it looked as though the pair was trying very hard to recover Q2 losses. Last week’s spike of USD-strength after that inflation print had helped to dent that bullish trend, but buyers came-back ahead of a test of the 1.1600 level. That point of reversal last week was also around the 61.8% retracement of the prior bullish short-term move in the pair. Prices have re-ascended back to the 23.6% retracement, at which point short-term resistance has started to show.
EUR/USD Four-Hour Price Chart: Q3 Trend Pullback or Reversal?
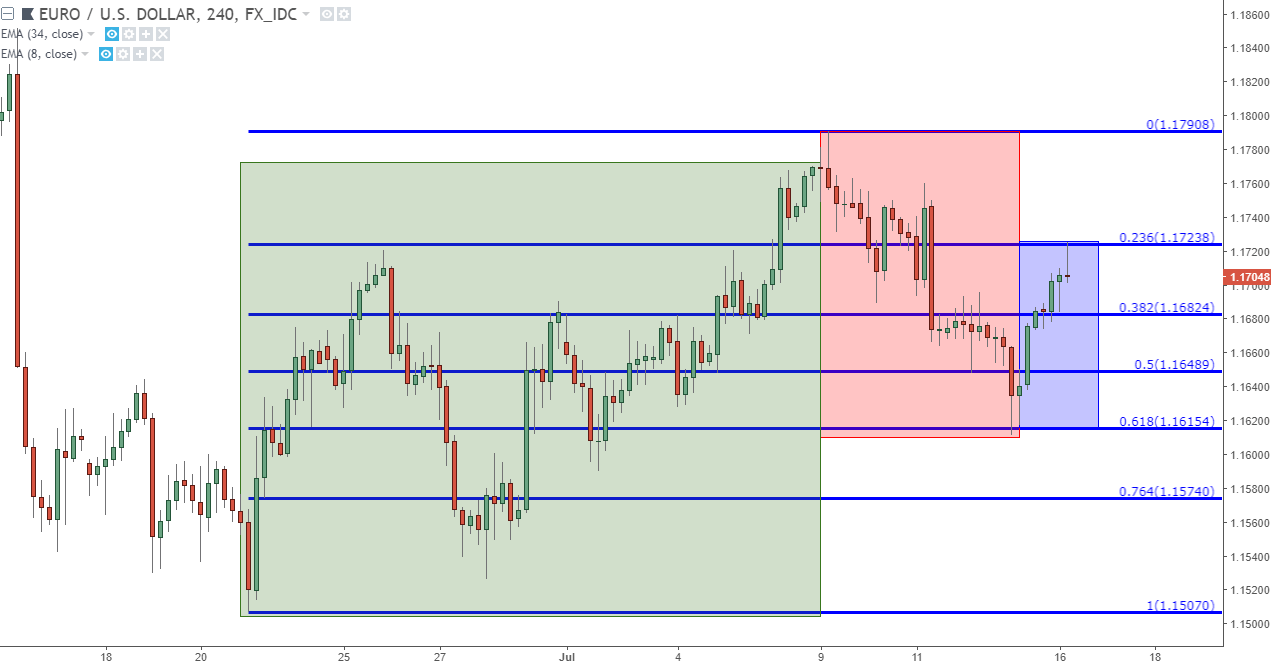
Chart prepared by James Stanley
On a longer-term basis, this brings to question the viability of a larger EUR/USD recovery. Last week’s short-term lower-low, combined with resistance re-appearing in the key zone that runs from 1.1685-1.1736 raises the possibility of bearish continuation from last quarter’s rather pronounced down-trend. If we do see prices hold below the top-side of this zone through the early portion of this week’s trade, the door is opened for bearish strategies in EUR/USD, positioned around the build of lower-highs after last week’s print of a lower-low.
EUR/USD Four-Hour Price Chart: Recovery Set Back – Pullback in Bullish Trend or Re-Emergence of Bears?
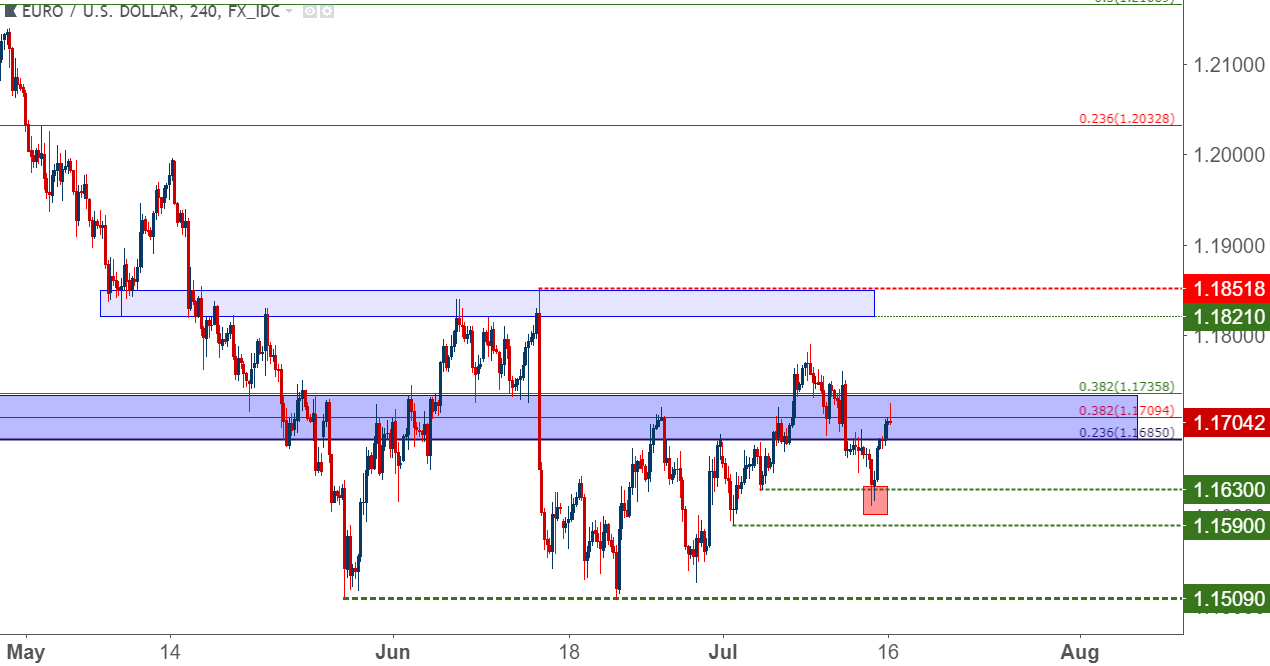
Chart prepared by James Stanley
GBP/USD Bounce from Fibonacci Support into Trend-Line Resistance
Cable is testing resistance as we open up this week, and Wednesday brings a key piece of inflation data out of the UK, ahead of the bank’s ‘Super Thursday’ rate decision set to take place in August. Odds for a rate hike have continued to build around the Bank of England, and this is very much driven by the continued run of inflation above the bank’s 2% target. The expectation for Wednesday’s inflation data out of the UK is for a print of 2.6%, which would put the bank on track to hike next month, and this could bring some additional strength into the British Pound.
In the Pound, prices re-tested a key area of Fibonacci support last week before that Dollar reversal started to show on Friday. Prices are now testing an area of trend-line resistance that had previously helped to hold the highs, save for a brief breech two weeks ago as driven by dynamics around Brexit. The pair initially traded through resistance on news of a ‘soft Brexit’ proposal out of the UK government, but soon reversed back-below as resignations started to flow in from PM May’s cabinet.
This puts focus on the July swing-high in the pair that runs from 1.3336-1.3363, and if we see a top-side break here, the door re-opens for bullish strategies targeting the 1.3478 area of Fibonacci resistance.
GBP/USD Four-Hour Price Chart: From Fibonacci Support to Trend-Line Resistance

Chart prepared by James Stanley
US Stocks Maintain Strength as Powell Testimony Nears
The Q3 theme of strength in US stocks has largely remained unfettered through last week’s dynamics in the US Dollar, and as we open up a fresh week that theme remains. The S&P 500 is holding on to those five-month highs while the Dow Jones Industrial Average attempts to maintain above the key 25,000 psychological level, and this sets the stage for the start of tomorrow’s testimony from Chair Powell on Capitol Hill.
The S&P 500 is testing a key area on the chart as we open this week’s trade, and prices are currently holding around the 78.6% retracement of the February sell-off. This is just slightly above the swing high from the month of March, which took place very near our current price in the S&P 500, which is around the 2800 psychological level.
S&P 500 Daily Chart: Testing Fibonacci Resistance at Five-Month Highs
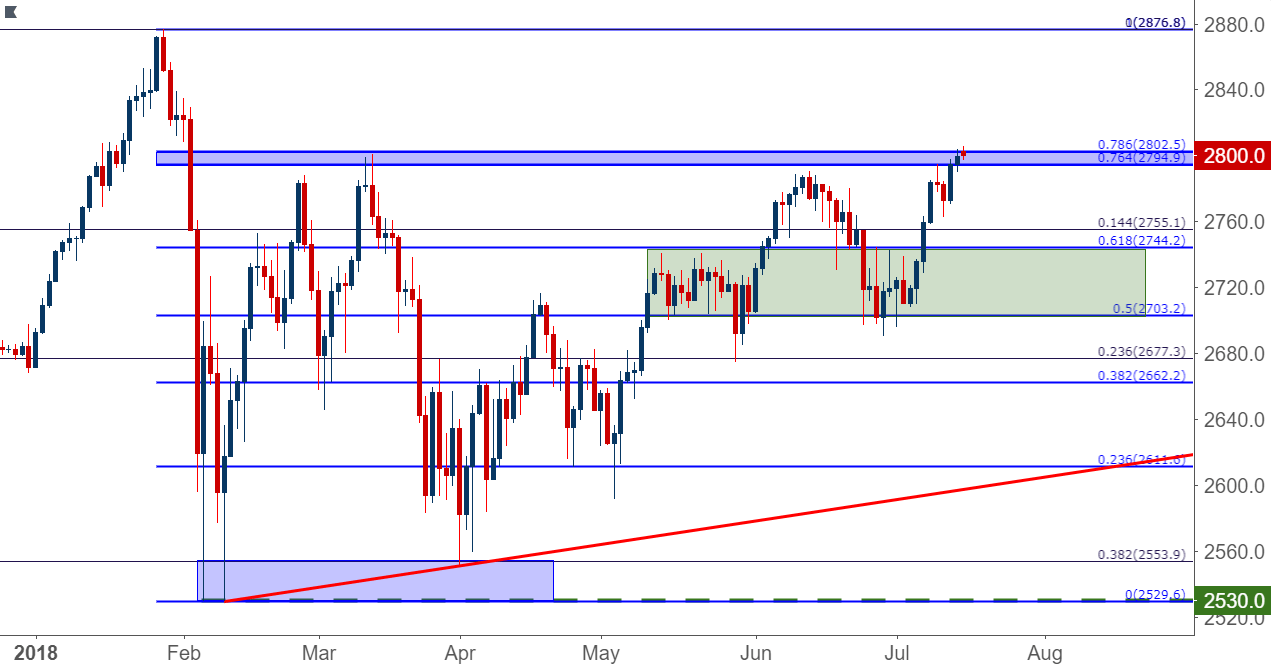
Chart prepared by James Stanley
Dow Jones Crosses 25,000: Can it Hold?
In the Dow Jones, we’d looked at the build of higher-low support last week, and prices soon crossed back-above the 25,000 level on the index. We’ve seen a bit of resistance develop around the 14.4% retracement of the April-June bullish move, and this puts focus on the 23.6% area in the search for higher-low support. If we do see prices pullback to this area in the early-portion of the week, coupled with a sense of short-term support, the door can re-open to bullish continuation strategies with targets set towards the June highs of 25,370.
Dow Jones Four-Hour Price Chart: Bullish Continuation Prospects
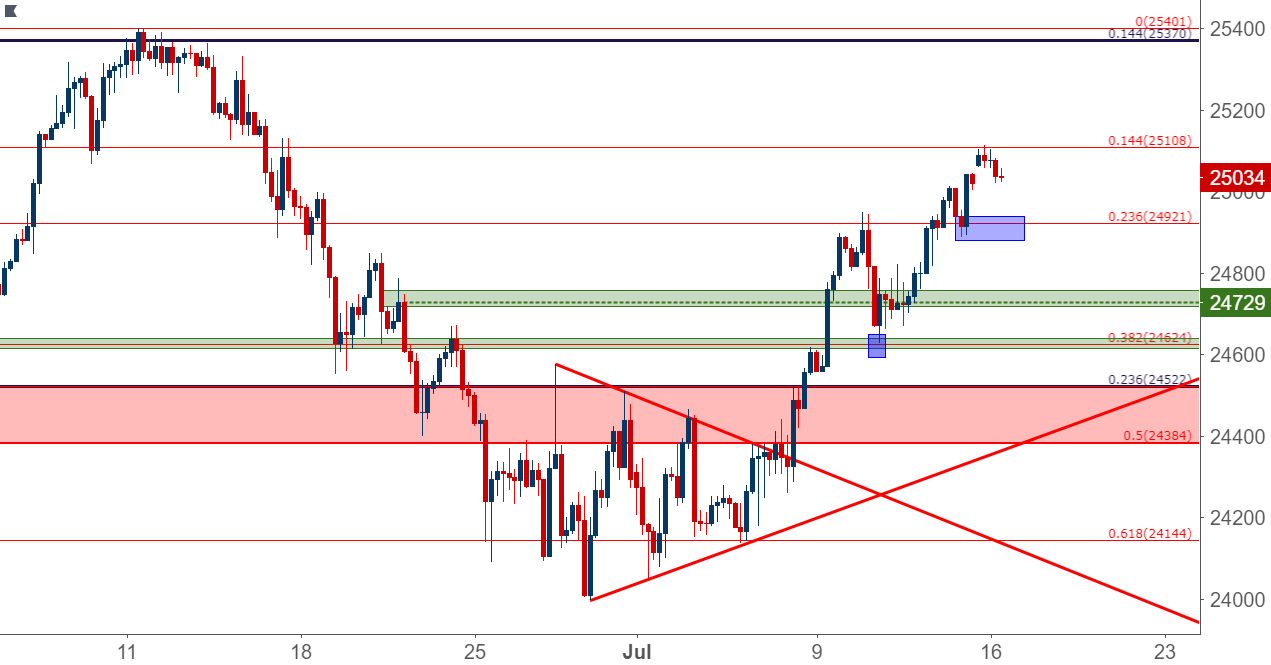
Chart prepared by James Stanley
To read more:
Are you looking for longer-term analysis on the U.S. Dollar? Our DailyFX Forecasts for Q1 have a section for each major currency, and we also offer a plethora of resources on USD-pairs such as EUR/USD, GBP/USD, USD/JPY, AUD/USD. Traders can also stay up with near-term positioning via our IG Client Sentiment Indicator.
Forex Trading Resources
DailyFX offers a plethora of tools, indicators and resources to help traders. For those looking for trading ideas, our IG Client Sentiment shows the positioning of retail traders with actual live trades and positions. Our trading guides bring our DailyFX Quarterly Forecasts and our Top Trading Opportunities; and our real-time news feed has intra-day interactions from the DailyFX team. And if you’re looking for real-time analysis, our DailyFX Webinars offer numerous sessions each week in which you can see how and why we’re looking at what we’re looking at.
If you’re looking for educational information, our New to FX guide is there to help new(er) traders while our Traits of Successful Traders research is built to help sharpen the skill set by focusing on risk and trade management.
--- Written by James Stanley, Strategist for DailyFX.com
Contact and follow James on Twitter: @JStanleyFX


