


Talking Points:
- US Stocks remain under pressure as we move towards the end of the second quarter and the first half of 2018. The Dow started to turn from Fibonacci resistance around the FOMC rate hike earlier in June, and since then the topic of trade wars or tariffs have likely contributed to a continuation of bearish price action.
- The Dow Jones dropped below a big zone of support yesterday, and this exposes a bullish trend-line that can be found from the February, April and May lows in the index. This area is confluent with the 76.4$ Fibonacci retracement of the April-June bullish move; and if we’re unable to hold here, a re-test of prior February or April lows would become more likely.
- DailyFX Forecasts are available from the DailyFX Trading Guides page. If you’re looking to improve your trading approach, check out Traits of Successful Traders. And if you’re looking for an introductory primer to the Forex market, check out our New to FX Guide.
Do you want to see how retail traders are currently trading the US Dollar? Check out our IG Client Sentiment Indicator.
Dow Continues Bearish Turn as End of Q2 Nears
It’s been a rocky past couple of weeks in US stocks. Ever since the Federal Reserve’s rate hike in mid-June, US equities have continued to face varying forms of pressure. And while some of the selling may be emanating from fears around trade wars or tariffs, the timing of this turn lines up fairly well with the hawkish FOMC outlay that was seen earlier in the month. That led into a consistent string of losses for the Dow Jones Industrial Average as the index has put in a 1,000+ point move over the past two weeks. We had first looked at a short-side setup ahead of that FOMC rate decision, and then last week we started to look for support. The Dow had run into a key zone, and on Friday prices displayed a bit of respect for that zone.
That respect was short-lived, however, as sellers came right back after the Monday open and helped to push the index down to a fresh June low as we approach the end of Q2.
Dow Jones Four-Hour Chart: Bounce From Support Zone Short-Lived, Sellers Drive to Fresh June Lows

Chart prepared by James Stanley
We’d previously looked at the prospect of bearish breakouts should that support zone give way, and prices quickly ran to the first target of 24,144, which is the 61.8% Fibonacci retracement of the April-June bullish run. There is one additional target underneath current price action, and this lines up with the bullish trend-line that can be found by taking the lows from February, April and May. This area is confluent with the 76.4% retracement of that April-June move, and if we do see a show of support there, the door opens for bullish reversal setups.
Dow Jones Daily Chart: Deeper Support Potential at February, April, May Bullish Trend-Line
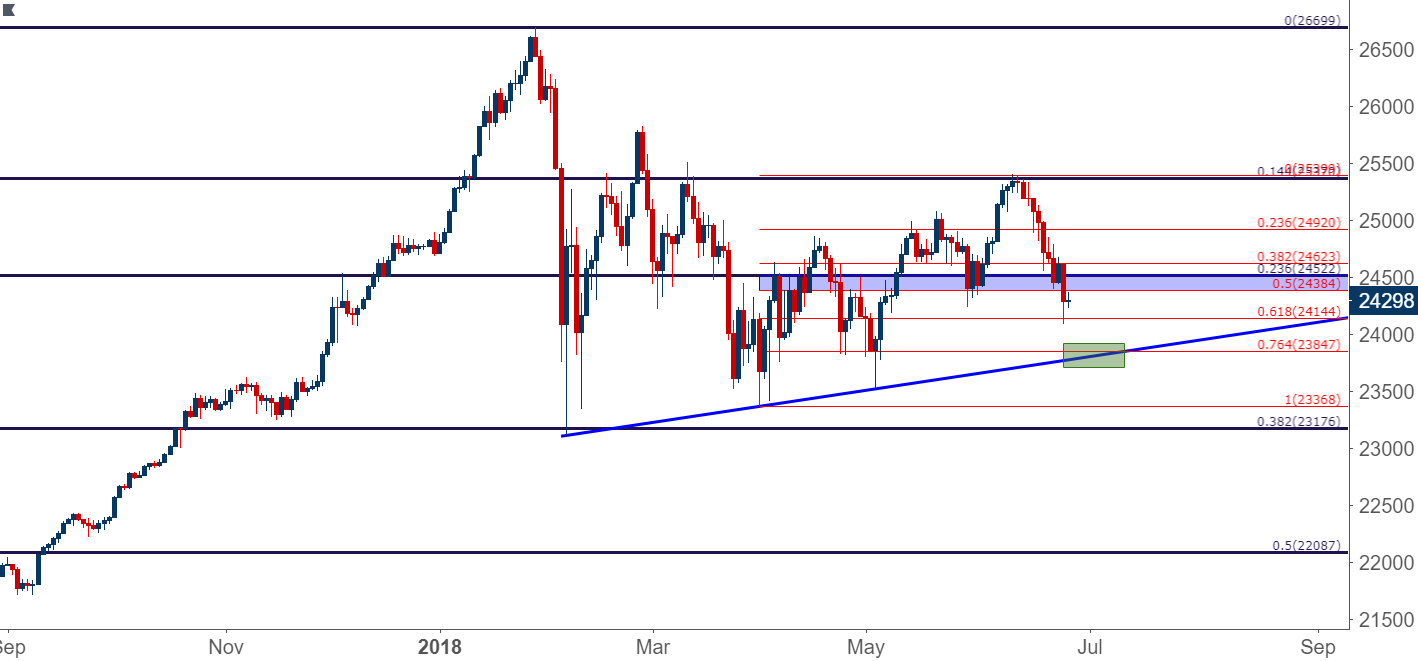
Chart prepared by James Stanley
The Alternative Scenario
Should that bullish trend-line become broken, traders would likely want to remain cautious until we see a deeper test of the lows set earlier in the year. Around 23,176 we have the 38.2% retracement of the post-Election move in the Dow, and this is the area that had helped to catch the lows from the February sell-off. This would expose a vacuum on the charts, from that trend-line down to the February lows in which directional positioning could remain challenging. For those looking for the ‘big short,’ a break of that February low would make the prospect of big-picture bearish continuation look significantly more convincing, as a down-side break of this bullish trend-line could still see follow-through support around a prior swing (the April or May swing lows).
Dow Jones Daily Chart: Subordinated Support Potential From February Low up to Bullish Trendline

Chart prepared by James Stanley
To read more:
Are you looking for longer-term analysis on the U.S. Dollar? Our DailyFX Forecasts for Q1 have a section for each major currency, and we also offer a plethora of resources on USD-pairs such as EUR/USD, GBP/USD, USD/JPY, AUD/USD. Traders can also stay up with near-term positioning via our IG Client Sentiment Indicator.
Forex Trading Resources
DailyFX offers a plethora of tools, indicators and resources to help traders. For those looking for trading ideas, our IG Client Sentiment shows the positioning of retail traders with actual live trades and positions. Our trading guides bring our DailyFX Quarterly Forecasts and our Top Trading Opportunities; and our real-time news feed has intra-day interactions from the DailyFX team. And if you’re looking for real-time analysis, our DailyFX Webinars offer numerous sessions each week in which you can see how and why we’re looking at what we’re looking at.
If you’re looking for educational information, our New to FX guide is there to help new(er) traders while our Traits of Successful Traders research is built to help sharpen the skill set by focusing on risk and trade management.
--- Written by James Stanley, Strategist for DailyFX.com
Contact and follow James on Twitter: @JStanleyFX


