


Talking Points:
- The Dow Jones Industrial Average has continued up to fresh two-month highs, finding resistance at the 14.4% Fibonacci retracement of the post-Election move in the Dow.
- The next couple of days bring heightened event risk around global markets, as tomorrow’s FOMC rate decision leads into an ECB meeting in which market participants are looking for details about how the ECB may look to start tapering QE purchases. This could have a large bearing on risk assets, such as US stocks.
- DailyFX Forecasts are available from the DailyFX Trading Guides page. If you’re looking to improve your trading approach, check out Traits of Successful Traders. And if you’re looking for an introductory primer to the Forex market, check out our New to FX Guide.
Do you want to see how retail traders are currently trading the US Dollar? Check out our IG Client Sentiment Indicator.
Dow Finds Fibonacci Resistance at Fresh Two-Month Highs
The Dow Jones Industrial Average continued its bullish ascent last week, running up to fresh two-month highs as we near Wednesday’s FOMC rate decision. In our last article on Thursday, we looked at the prospect of bullish plays in the Dow, looking for a pullback to the prior two-month high in the effort of playing prior resistance as fresh support. Our first target at 25,370 has been met, and prices remain near this level after multiple failed tests to breakthrough yesterday. This is a notable level, as this is the 14.4% Fibonacci retracement of the post-Election move in the Dow, and this was the same area that helped to produce the March swing-high.
Dow Jones Two-Hour Chart: Support at Prior Resistance Leads to Fresh Two-Month Highs
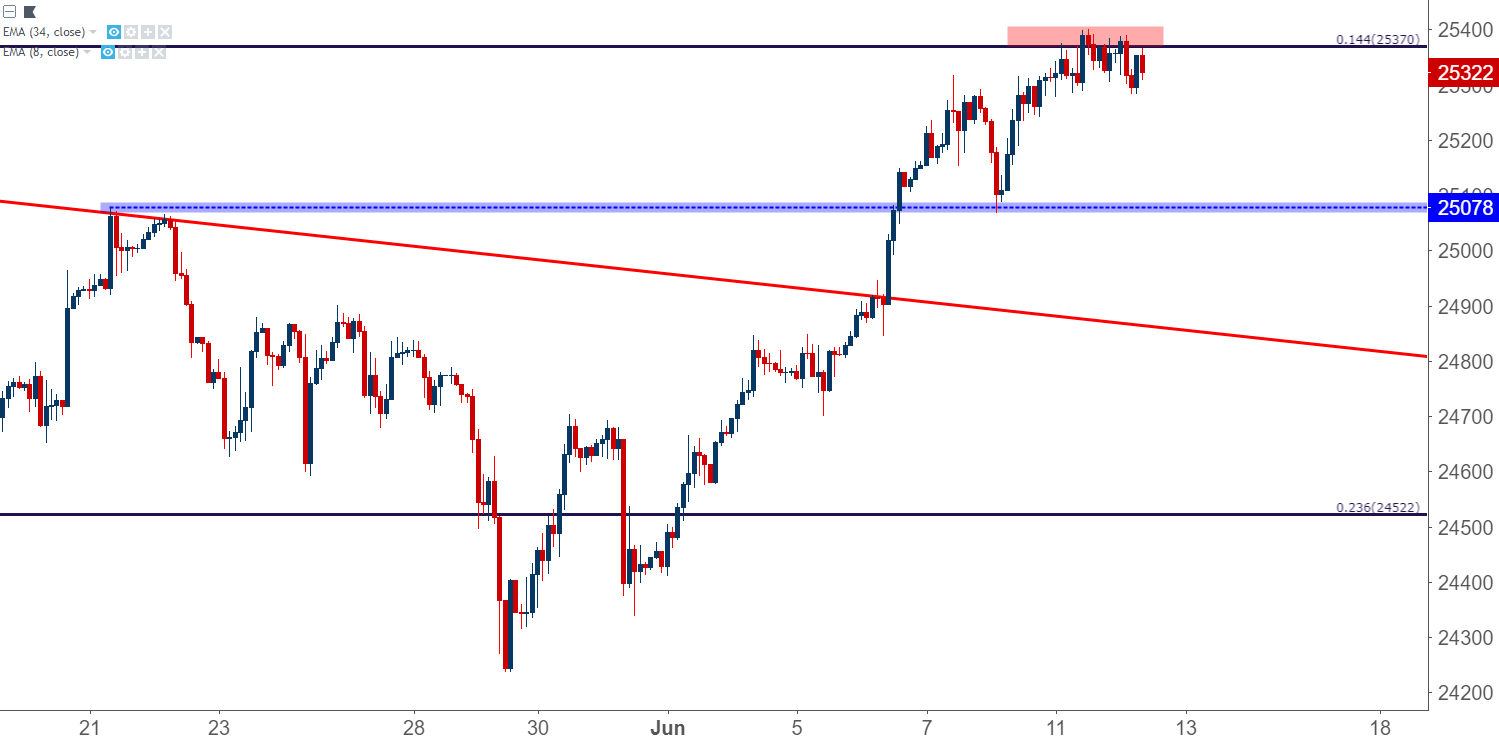
Chart prepared by James Stanley
At this stage, it can be difficult to muster attractive near-term trade setups as we approach a heightened outlay of risk over the next couple of days. Tomorrow brings a key rate decision out of the Federal Reserve, and the wide-expectation is that we’ll get another 25 basis point hike. More pressing, however, will be the bank’s tolerance for rate hikes in the latter-half of this year, and that very much remains a point of contention. In the last dot plot matrix, the Fed alluded to the prospect of three hikes this year, which would mean one additional after tomorrow’s move. This can keep that bullish backdrop in US stocks; but if the Fed is to show expectation for a fourth hike, this could act as a hindrance to further gains.
As such, locating attractive topside setups could be challenging as prices remain rather far away from any near-by points of support.
For traders looking at reversal setups, that possibility remains, particularly if today’s price action holds below the 14.4% Fibonacci retracement; amounting to two consecutive days of resistance holding at this key level ahead of the FOMC. This would be a counter-trend setup ahead of a big piece of event risk, so traders would need to appropriately manage the position so that if fresh highs do print, the trade is exited with the goal of loss mitigation.
Dow Jones Daily Chart: Hold of Fibonacci Resistance Opens Door for Bearish Reversals

Chart prepared by James Stanley
To read more:
Are you looking for longer-term analysis on the U.S. Dollar? Our DailyFX Forecasts for Q1 have a section for each major currency, and we also offer a plethora of resources on USD-pairs such as EUR/USD, GBP/USD, USD/JPY, AUD/USD. Traders can also stay up with near-term positioning via our IG Client Sentiment Indicator.
Forex Trading Resources
DailyFX offers a plethora of tools, indicators and resources to help traders. For those looking for trading ideas, our IG Client Sentiment shows the positioning of retail traders with actual live trades and positions. Our trading guides bring our DailyFX Quarterly Forecasts and our Top Trading Opportunities; and our real-time news feed has intra-day interactions from the DailyFX team. And if you’re looking for real-time analysis, our DailyFX Webinars offer numerous sessions each week in which you can see how and why we’re looking at what we’re looking at.
If you’re looking for educational information, our New to FX guide is there to help new(er) traders while our Traits of Successful Traders research is built to help sharpen the skill set by focusing on risk and trade management.
--- Written by James Stanley, Strategist for DailyFX.com
Contact and follow James on Twitter: @JStanleyFX


