


Talking Points:
- The Dow Jones Industrial Average gapped-higher to start the week, and a range has since built-in that runs from the approximate 24,750-24,850.
- The longer-term symmetrical wedge pattern remains in the Dow Jones despite the S&P 500’s topside break to fresh two-month highs. This keeps longer-term strategies at bay on the Dow, at least until we see some element of resolution in the longer-term wedge formation.
- DailyFX Forecasts have been updated for Q2, and are available from the DailyFX Trading Guides page. If you’re looking to improve your trading approach, check out Traits of Successful Traders. And if you’re looking for an introductory primer to the Forex market, check out our New to FX Guide.
Do you want to see how retail traders are currently trading the US Dollar? Check out our IG Client Sentiment Indicator.
Dow Jones Bullish Breakout Continues to Fresh Two-Month Highs
US stocks continue to show strength after the February pullback helped to build-in congestion formations across a number of indices. In the Dow, we looked at a bullish setup on Tuesday of this week, and prices have promptly took out both topside targets as buyers have continued to drive.
This led to a bullish break of the symmetrical wedge formation that we’ve been following; along with a print of fresh two-month highs as buyers have remained in-control.
Dow Jones Daily Chart: Bullish Break of Symmetrical Wedge, Fresh Two-Month Highs
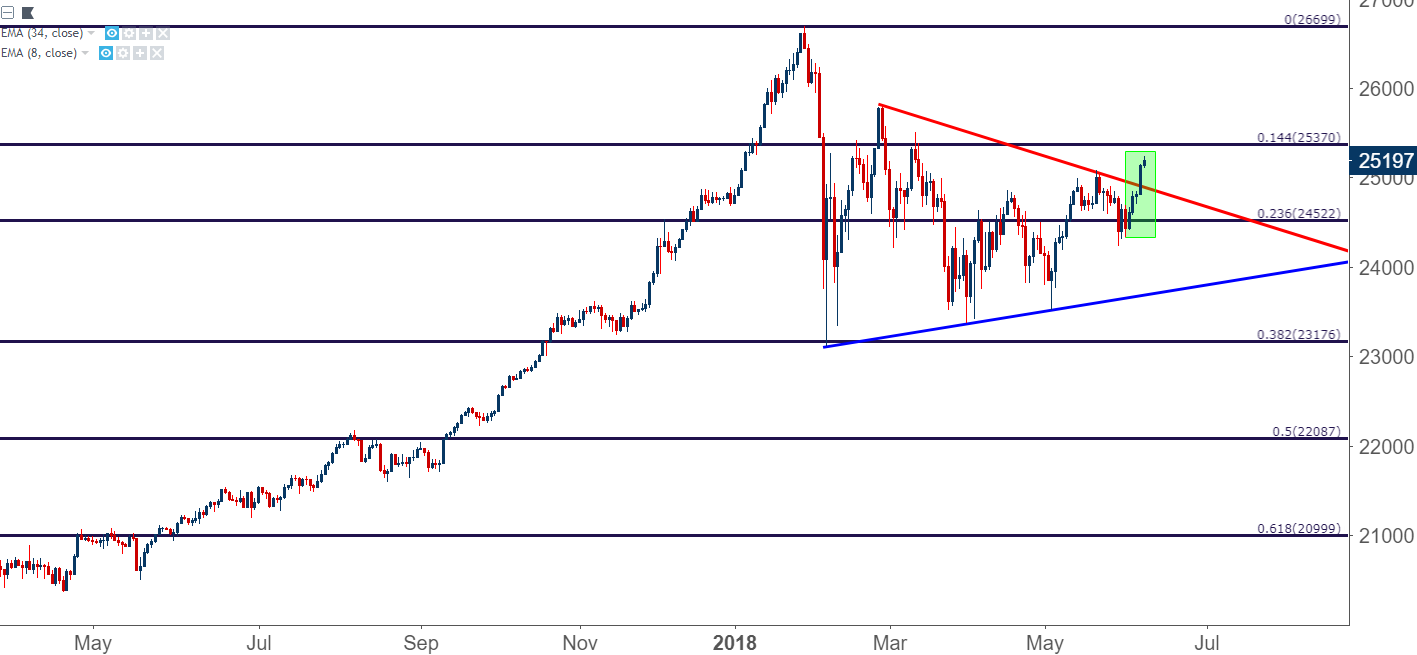
Chart prepared by James Stanley
As we wrote on Tuesday, this bullish break opens the door for longer-term topside continuation strategies. US equity prices began to pullback in early-February, and the remainder of Q1 continued in a rather uncertain manner as bulls were unable to re-engage with the prior up-trend. For an index like the Dow, which was up by almost 50% after the Presidential election, the prospect of a deeper pullback very much remained a possibility, particularly as the Fed kept the door open for a full four rate hikes in 2018.
At this stage, those looking at longer-term strategies would likely want to await some element of pullback before looking to continue the move as the short-term formation here is quite stretched. The prior high could be of assistance, and this takes place at 25,078. This can be connected to the psychological level of 25,000 to produce a potential support zone that could be utilized on a pullback to open the door for bullish strategies.
Dow Jones Two-Hour Chart: Higher-Low Support Potential Around Prior Resistance

Chart prepared by James Stanley
Above current price action are a number of interesting areas to look to for profit targets. At 25,370, we have the 14.4% retracement of the post-Election move, and a bit-higher at 25,512 we have the March swing-high. The February high is at 25,825, and if we’re able to re-test there, then a move towards the all-time high at 26,700 would start to look a bit more attractive.
Dow Jones Daily Chart: Deeper Resistance Potential on Continued Bullish Move
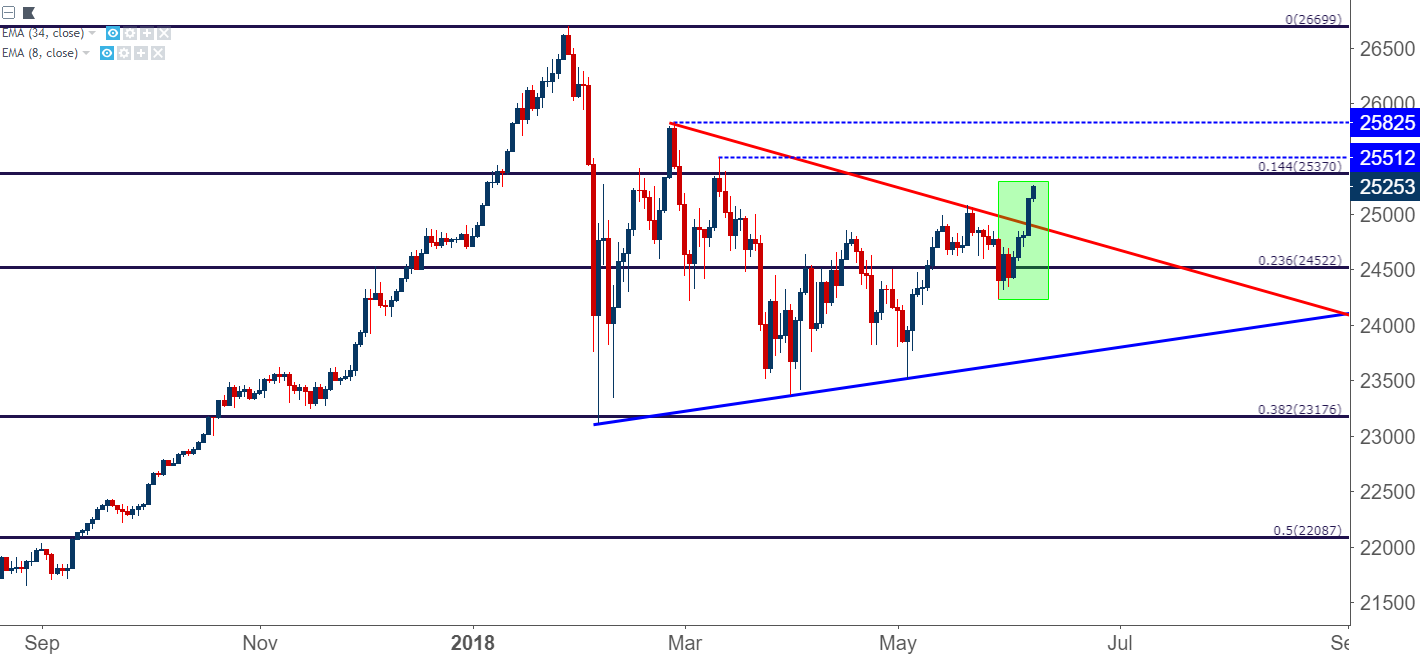
Chart prepared by James Stanley
To read more:
Are you looking for longer-term analysis on the U.S. Dollar? Our DailyFX Forecasts for Q1 have a section for each major currency, and we also offer a plethora of resources on USD-pairs such as EUR/USD, GBP/USD, USD/JPY, AUD/USD. Traders can also stay up with near-term positioning via our IG Client Sentiment Indicator.
Forex Trading Resources
DailyFX offers a plethora of tools, indicators and resources to help traders. For those looking for trading ideas, our IG Client Sentiment shows the positioning of retail traders with actual live trades and positions. Our trading guides bring our DailyFX Quarterly Forecasts and our Top Trading Opportunities; and our real-time news feed has intra-day interactions from the DailyFX team. And if you’re looking for real-time analysis, our DailyFX Webinars offer numerous sessions each week in which you can see how and why we’re looking at what we’re looking at.
If you’re looking for educational information, our New to FX guide is there to help new(er) traders while our Traits of Successful Traders research is built to help sharpen the skill set by focusing on risk and trade management.
--- Written by James Stanley, Strategist for DailyFX.com
Contact and follow James on Twitter: @JStanleyFX


