


Talking Points:
- The Dow Jones Industrial Average gapped-higher to start the week, and a range has since built-in that runs from the approximate 24,750-24,850.
- The longer-term symmetrical wedge pattern remains in the Dow Jones despite the S&P 500’s topside break to fresh two-month highs. This keeps longer-term strategies at bay on the Dow, at least until we see some element of resolution in the longer-term wedge formation.
- DailyFX Forecasts have been updated for Q2, and are available from the DailyFX Trading Guides page. If you’re looking to improve your trading approach, check out Traits of Successful Traders. And if you’re looking for an introductory primer to the Forex market, check out our New to FX Guide.
Do you want to see how retail traders are currently trading the US Dollar? Check out our IG Client Sentiment Indicator.
US Stocks Hold the Weekly Gap Through Monday Trade
US stocks started the week with a bang, gapping higher and further reversing losses from the prior week. Those losses in the prior week were driven by a combination of fears around European politics and trade wars/tariffs, and as each of those risks have receded behind the headlines, equity bulls have pushed both the Dow Jones and the S&P 500 up to fresh near-term highs. There is a case of divergence, however, as the S&P 500 is working on fresh two-month highs while the Dow remains more subdued, continuing to trade below the 25,000 psychological level.
The trend-line that we looked at in the Dow Jones Industrial Average on Friday has resolved in a bullish manner. Yesterday saw prices gap-up towards 24,850 shortly after the open, and that area has held after another test in the overnight session. Short-term support, on the other hand, continues to show about 100 points lower, around 24,750; making for a near-term range that can be usable for shorter-term approaches as we move deeper into this week.
Dow Jones Hourly Chart (Prices Based Off of Dow Jones-based CFD (Contract For Difference))

Chart prepared by James Stanley
On a longer-term basis, the index remains within a digestion pattern as the symmetrical wedge produced by the February pullback/sell-off continues to hold current prices. This helps to demarcate key points on the chart, as a break of 25,078 (the May swing high) or support at 23,514 (May swing low) opens the door for longer-term directional plays in the Dow.
Dow Jones Daily Chart (Prices Based Off of Dow Jones-based CFD (Contract For Difference))
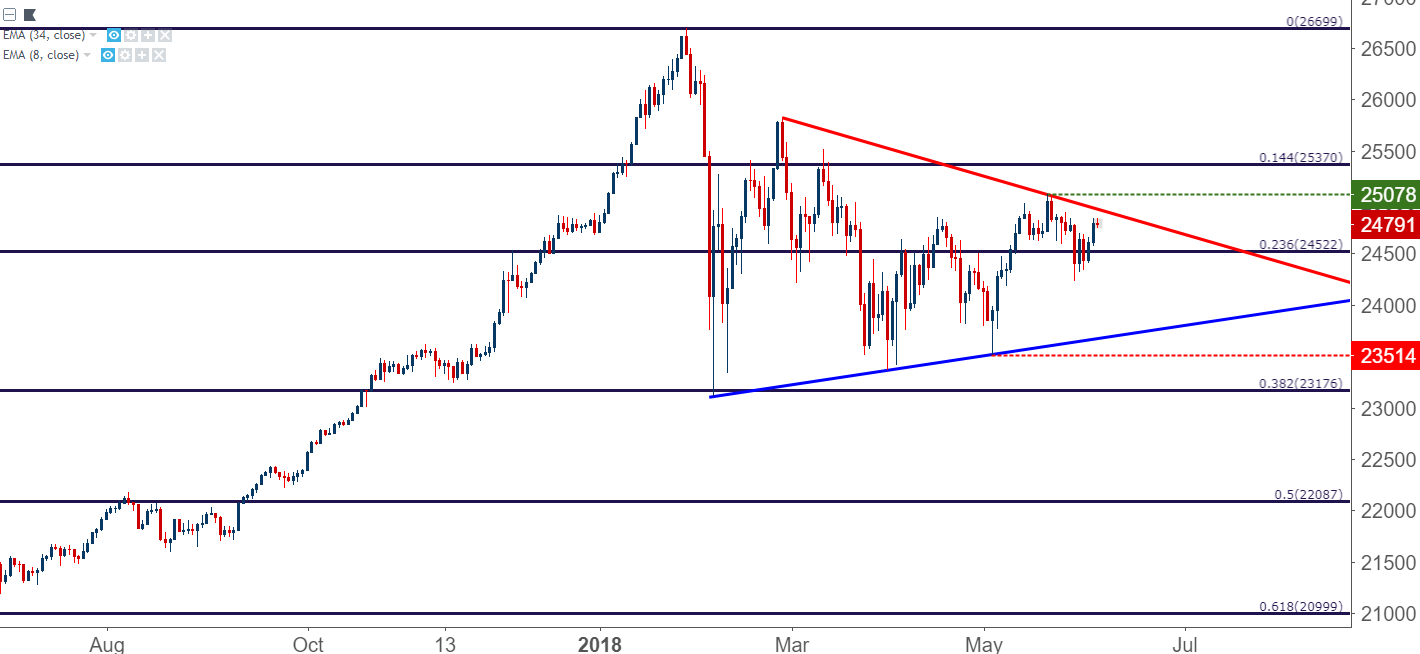
Chart prepared by James Stanley
Moving Forward
Combining the above two vantage points, and traders can look to the short-term range in the Dow with a bullish bias, anticipating that last week’s topside breakout can continue to a deeper area of resistance. This opens up the possibility of topside targets at 24,900 and 24,965; at which point we would have an encounter with the resistance side of that longer-term symmetrical wedge formation.
Dow Jones Four-Hour Chart (Prices Based Off of Dow Jones-based CFD (Contract For Difference))

Chart prepared by James Stanley
To read more:
Are you looking for longer-term analysis on the U.S. Dollar? Our DailyFX Forecasts for Q1 have a section for each major currency, and we also offer a plethora of resources on USD-pairs such as EUR/USD, GBP/USD, USD/JPY, AUD/USD. Traders can also stay up with near-term positioning via our IG Client Sentiment Indicator.
Forex Trading Resources
DailyFX offers a plethora of tools, indicators and resources to help traders. For those looking for trading ideas, our IG Client Sentiment shows the positioning of retail traders with actual live trades and positions. Our trading guides bring our DailyFX Quarterly Forecasts and our Top Trading Opportunities; and our real-time news feed has intra-day interactions from the DailyFX team. And if you’re looking for real-time analysis, our DailyFX Webinars offer numerous sessions each week in which you can see how and why we’re looking at what we’re looking at.
If you’re looking for educational information, our New to FX guide is there to help new(er) traders while our Traits of Successful Traders research is built to help sharpen the skill set by focusing on risk and trade management.
--- Written by James Stanley, Strategist for DailyFX.com
Contact and follow James on Twitter: @JStanleyFX


