


Talking Points:
- US Equities have continued to pullback after last week’s FOMC and ECB rate decisions, and prices in the Dow are fast approaching the support zone that we’ve been following, taken from the 23.6% Fibonacci retracement of the post-Election move in the index.
- Bears have remained in-control, and if this support zone does not hold, the trend-line taken from the February, April and May lows is exposed as a potential point of deeper support. This can support downside breakout strategies should prices display an inability to hold above this key zone.
- DailyFX Forecasts are available from the DailyFX Trading Guides page. If you’re looking to improve your trading approach, check out Traits of Successful Traders. And if you’re looking for an introductory primer to the Forex market, check out our New to FX Guide.
Do you want to see how retail traders are currently trading the US Dollar? Check out our IG Client Sentiment Indicator.
Equity Sell-Off Continues, Dow Approaching Support Zone
US stocks have continued to sell-off since last week’s FOMC rate decision, and prices in the Dow Jones are now approaching the support zone that we looked at last Friday. During this sell-off, both bearish targets at 24,750 and 24,624 have been met, and the big question now is whether we get a revisit to the support zone that we were previously looking at for potential long scenarios.
Last week’s resistance came-off of the 14.4% Fibonacci retracement of the post-Election move in the index, and prices are now fast approaching the 23.6% marker of that same study.
Dow Jones Daily Chart: Pullback from 14.4% Fibonacci Retracement Continues
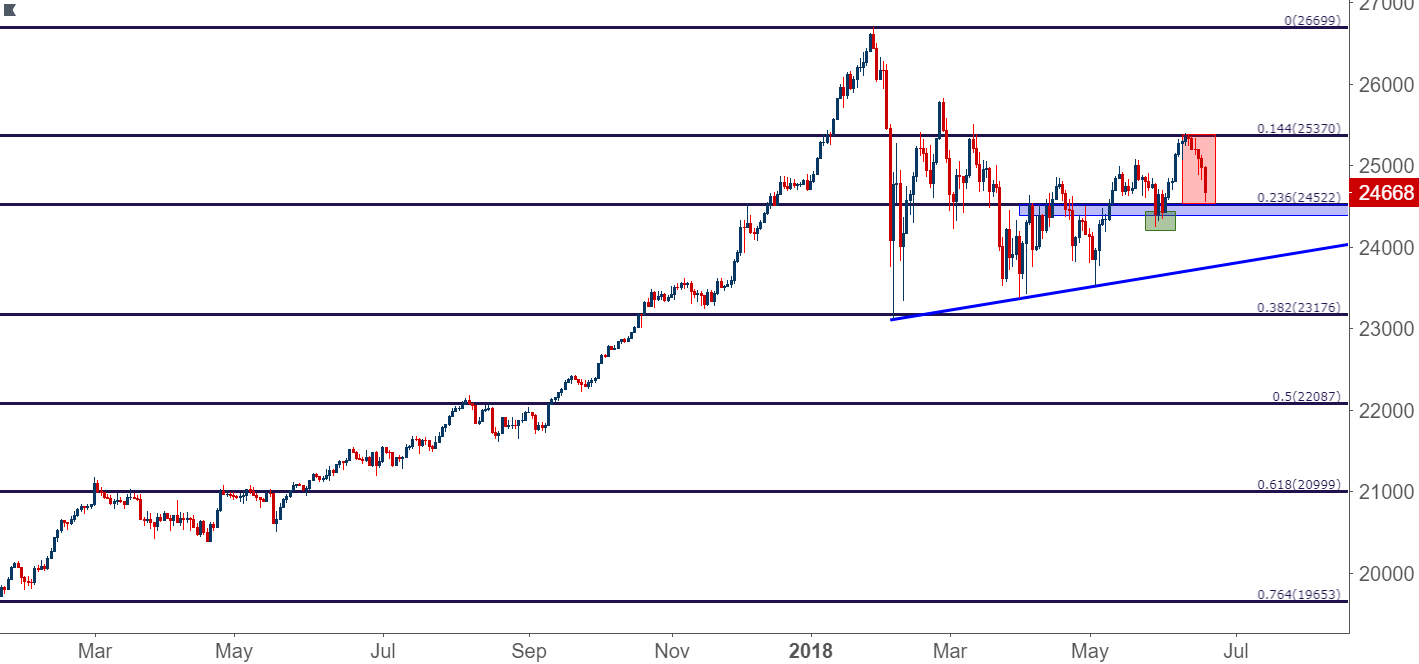
Chart prepared by James Stanley
The support zone that we’ve been following is a confluent area, as that 23.6% retracement from the post-Election move lines up closely with the 50% retracement of the April-June bullish run. That 50% retracement comes in at 24,384, and this is the same area that had helped to produce a swing-low in late-May, just before the Dow ran back-above the 25,000 psychological level. This can keep the door open for topside positions provided that buyers are able to hold support above the swing-low at 24,339.
Dow Jones Four-Hour Chart: Fast Approaching Key Support Zone

Chart prepared by James Stanley
Potential for Deeper Risk Aversion
Given the pace with which this sell-off has started to show, and also considering the drivers that have helped it to develop, and we may have a deeper bearish move in store. The fact that these equity turns began to show around last week’s FOMC and ECB rate decisions do not appear coincidental, and while many are attributing this sell-off to heightened trade tensions, there’s likely something to be said about both acting as some form of bearish catalyst in US stocks. It doesn’t appear as though the Fed is in a spot where they’ll abandon their hawkish drive anytime soon, nor does it appear as though trade tensions are all-of-the-sudden going to become resolved.
This can open the door to bearish breakout potential should prices pierce below the swing-low at 24,237, exposing downside target potential towards 24,144 and 23,847, at which point we’d have a trend-line coming into play taken from the prior February lows.
Dow Jones Four-Hour Chart: Deeper Bearish Breakout Potential

Chart prepared by James Stanley
To read more:
Are you looking for longer-term analysis on the U.S. Dollar? Our DailyFX Forecasts for Q1 have a section for each major currency, and we also offer a plethora of resources on USD-pairs such as EUR/USD, GBP/USD, USD/JPY, AUD/USD. Traders can also stay up with near-term positioning via our IG Client Sentiment Indicator.
Forex Trading Resources
DailyFX offers a plethora of tools, indicators and resources to help traders. For those looking for trading ideas, our IG Client Sentiment shows the positioning of retail traders with actual live trades and positions. Our trading guides bring our DailyFX Quarterly Forecasts and our Top Trading Opportunities; and our real-time news feed has intra-day interactions from the DailyFX team. And if you’re looking for real-time analysis, our DailyFX Webinars offer numerous sessions each week in which you can see how and why we’re looking at what we’re looking at.
If you’re looking for educational information, our New to FX guide is there to help new(er) traders while our Traits of Successful Traders research is built to help sharpen the skill set by focusing on risk and trade management.
--- Written by James Stanley, Strategist for DailyFX.com
Contact and follow James on Twitter: @JStanleyFX


