


Overall, trading in cryptocurrencies has become a bit more challenging in the past couple of months with charts broadly trending nowhere. But this doesn’t mean there isn’t good short-term set-ups waiting for the patient trader, such as the clean head-and-shoulders set-up in Ethereum not long ago. Ripple also at that time gave a good look.
Today, we’ll take a look at the recent rallies in Ethereum and Bitcoin as they are starting to show signs of ending and leading to another down-move in the not-too-distant future.
See how positioning changes in cryptocurrencies and other markets can help as a tool to determine price direction on the IG Client Sentiment page.
Ethereum rally brings familiar resistance into play
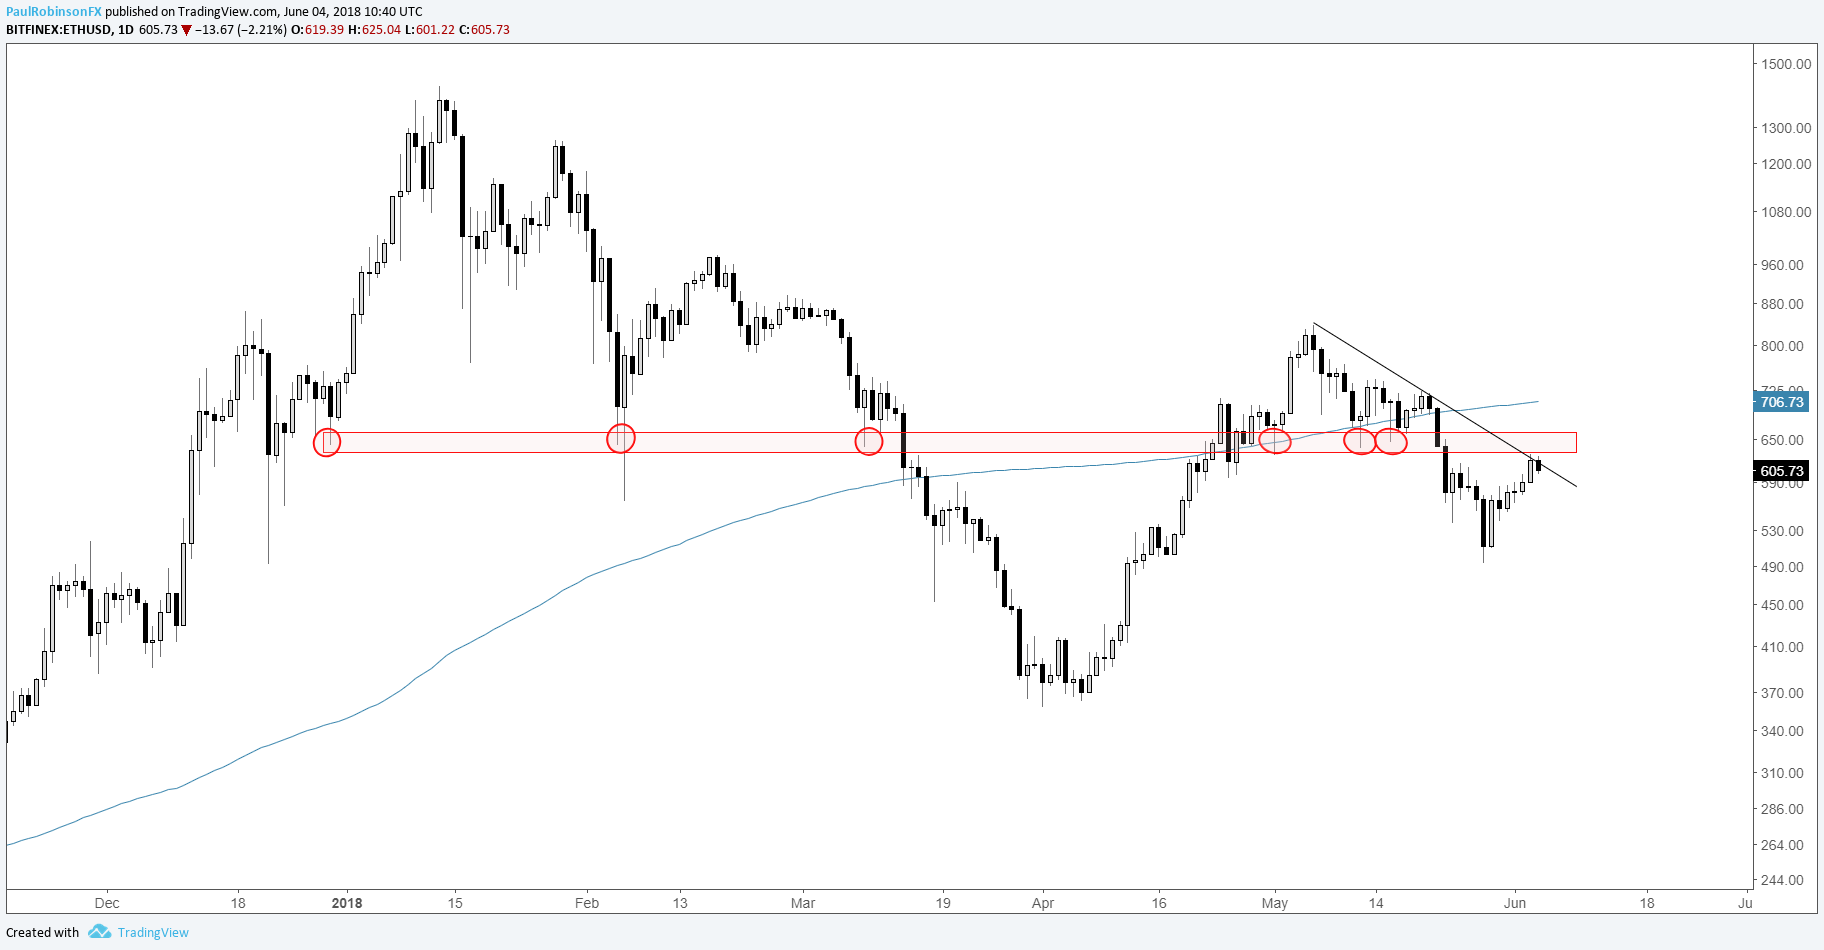
Ethereum spilled hard from the aforementioned head-and-shoulders pattern, but has since put in a sizable recovery. The rally, though, has a solid level of resistance in play, a familiar area from some time ago.
Coupling the longer-term area on the daily, turning to the 4-hr there is price resistance in confluence with a trend-line running off the peak last month. ETH/USD is currently sneaking below a minor trend-line off the late-month low. Looking for a continuation lower as the week progresses.
Check out this guide to learn more about how to trade Bitcoin and other cryptocurrencies.
ETH/USD Daily Chart (Resistance)
ETH/USD 4-hr Chart (Confluence of Resistance)

Bitcoin rising wedge could end corrective rally soon
On the 4-hr, Bitcoin is posting a rising wedge within the context of a downtrend. This has BTC/USD positioned to make a move lower, but traders will want to see it roll down out of the pattern first, as there is still a chance it pops to the top-side.
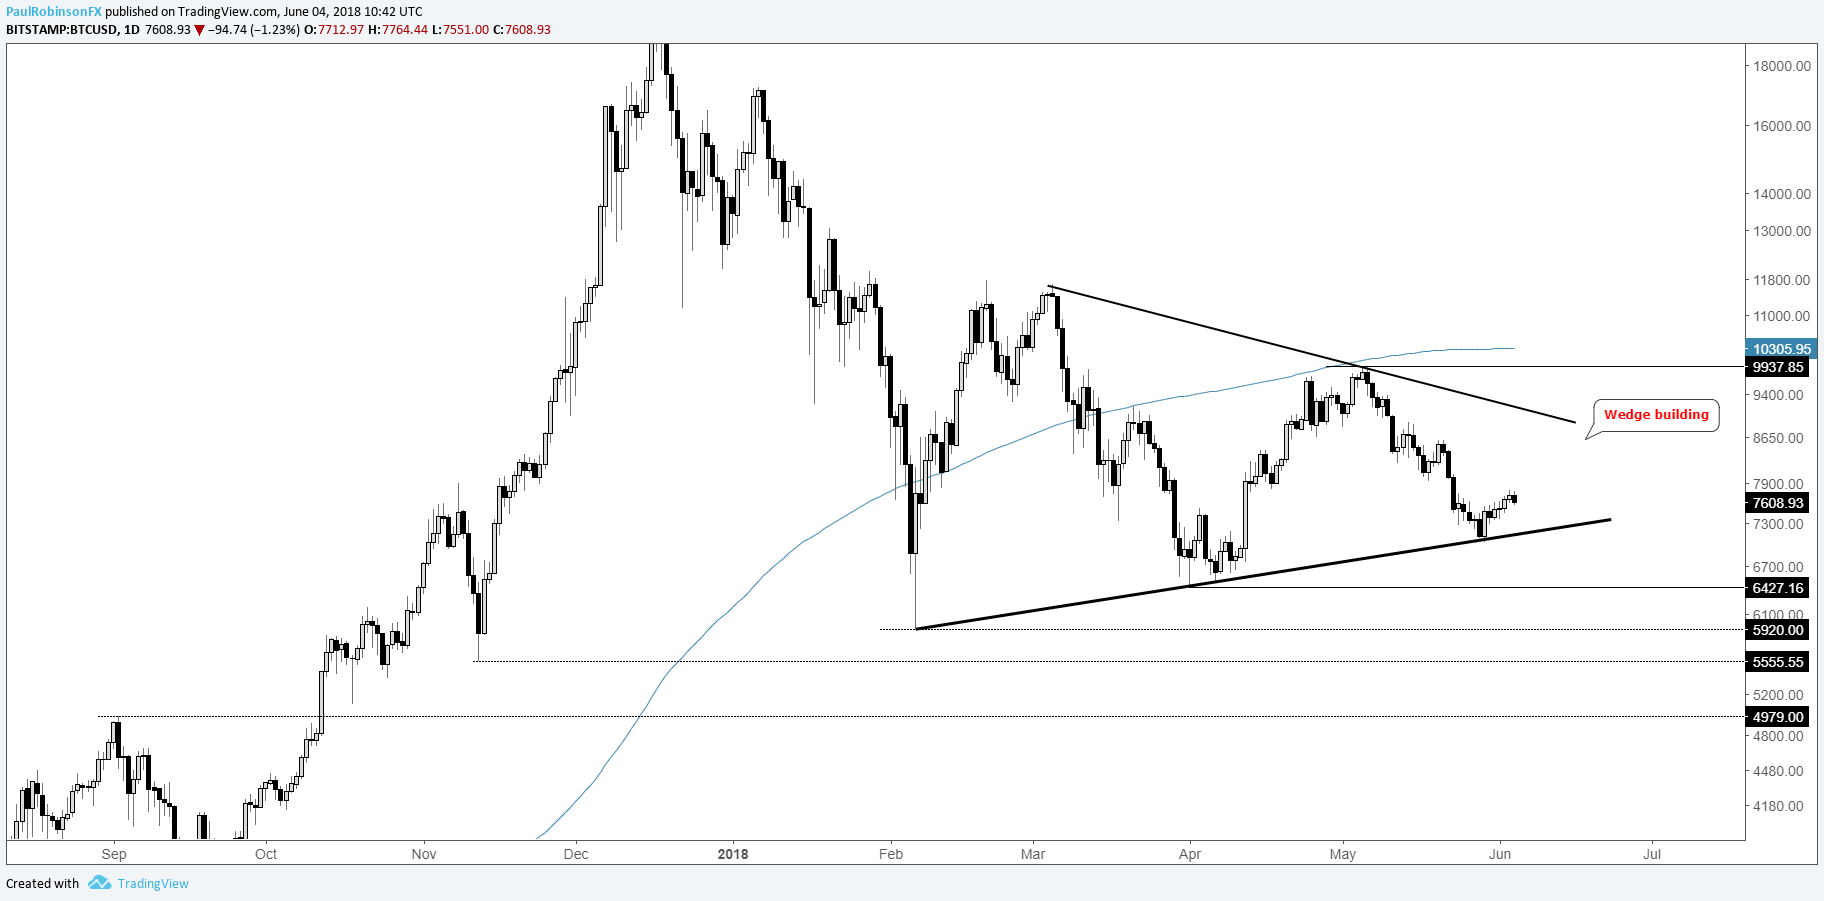
Potentially stopping downside momentum is a trend-line dating back to February, which may be apart of a maturing wedge in place since then. The pattern may want to further itself along towards the apex of the pattern, which, broadly speaking, would be a welcomed event as the pattern could down the line lead to a very strong move.
For now, leaning bearish and will continue to monitor. Keep an eye on the daily trend-line on weakness – a hold may give us the larger pattern at some point, while a break could lead down towards 6400.
BTC/USD Daily Chart (Watch lower-trend-line)
BTC/USD 4-hr Chart (Rising wedge set-up)

Helpful Resources for Cryptocurrency Traders
Whether you’re a new or experienced cryptocurrency trader, we have several resources to help you;Introduction to bitcoin trading guide, indicator for tracking trader sentiment, and a weekly webinar discussing the latest developments.
---Written by Paul Robinson, Market Analyst
You can follow Paul on Twitter at @PaulRobinsonFX


