In general, cryptocurrencies are sporting weak-looking charts after topping out earlier in the month. Ethereum, as noted in last week’s commentary, is holding up the best of the group, however; its outlook hangs in the balance as a couple of key technical structures come into view. Ripple is another which is coiling up, readying itself for a potentially strong move. Watch how the charts of the two aforementioned coins resolve themselves for indications on the others; Bitcoin, Litecoin, etc.
See how positioning changes in cryptocurrencies and other markets can help as a tool to determine price direction on the IG Client Sentiment page.
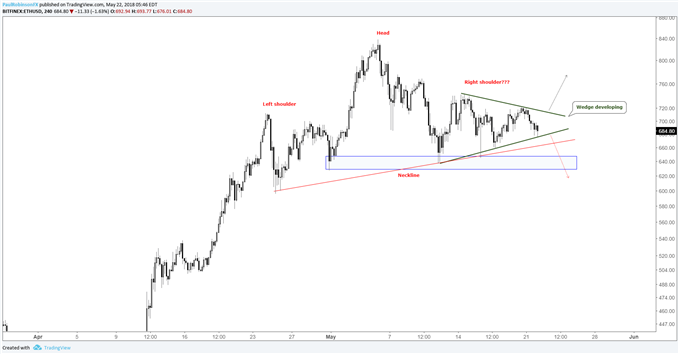
Ethereum has a pair of pattern possibilities
In the crypto-space Ethereum continues to have the healthiest looking chart, but depending on how the triangle forming since the 12th resolves itself, it too could join in on the selling seen in other pairs. Furthermore, a breakdown out of the triangle will also have a trigger of a head-and-shoulders topping pattern in play as well. There is strong daily support approximate confluence with the neckline of the pattern, so we would want to see a clean break below 627 before becoming too bearish.
Alternatively, if the triangle resolves itself upward then the bearish topping pattern is likely to be quickly negated and the hold of support validated as Ethereum will have itself positioned to lead cryptos higher. For now, we await a resolution from the triangle pattern before committing to a direction.
Check out this guide to learn more about how to trade Bitcoin and other cryptocurrencies.
ETH/USD 4-hr Chart (Patterns developing)

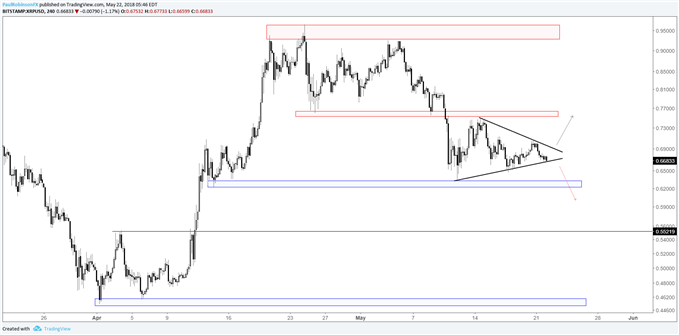
Ripple triangle nearing apex, ready to make a move
Like Ethereum, Ripple has been forming its own wedge on the 4-hr time-frame. Proximity to the apex of the triangle suggests it could break at any time now. In line with the trend off the May high, a downside resolution is slightly favored. But, with these patterns we have to take a reactive stance as symmetrical triangles are, in of themselves, directionless in their indications. On the downside there is support around the bottom of the triangle near 62-cents and on the topside there is resistance clocking in around 75-cents.
XRP/USD 4-hr Chart (Triangle nearing completion)

Helpful Resources for Cryptocurrency Traders
Whether you’re a new or experienced cryptocurrency trader, we have several resources to help you;Introduction to bitcoin trading guide, indicator for tracking trader sentiment, and a weekly webinar discussing the latest developments.
---Written by Paul Robinson, Market Analyst
You can follow Paul on Twitter at @PaulRobinsonFX


