


Highlights:
- US Dollar Index (DXY) at risk of breaking down below significant long-term support
- EUR/USD rallying from big support, could see it to 12500 relatively soon
- USD/JPY is still relatively neutral, but a big move could be on its way; Yen-crosses mostly sporting bullish technical backdrops
- Gold is still coiling up in a range, but could make a break for it (eventually)
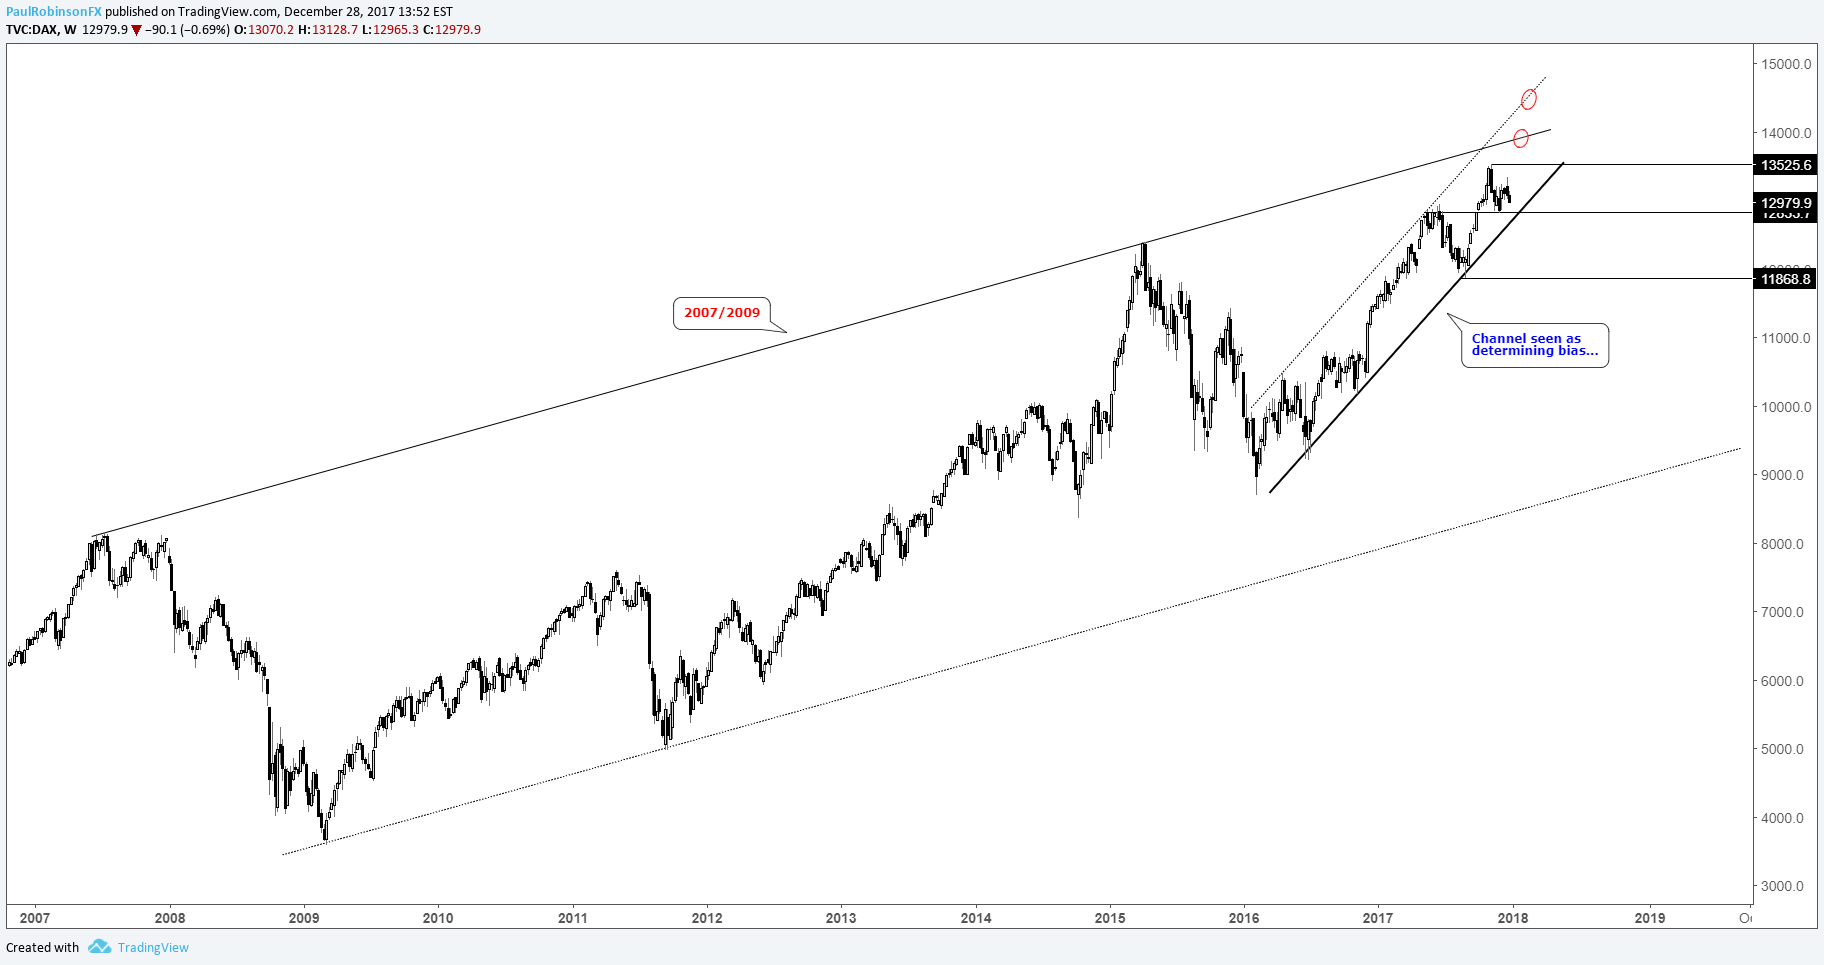
- DAX ‘bull-channel’ provides a clean guide
As 2018 is set to begin, here are a couple of guides to help you get started on the right foot – “Building Confidence in Trading” and “Traits of a Successful Trader”.
US Dollar Index (DXY)
The DXY was able to muster a bounce during the latter portion of 2017, but has fizzled out in recent weeks. The bounce originated from support dating back to 1998; 91s have been in play for a long time on numerous occasions as both support and resistance. As the new year rolls around, it looks as though this key long-term support level is in danger of breaking. A firm drop below 91 will have the underside trend-line from 2015 in view, but focus below there will come in on peaks created in 2009 and 2010, and perhaps even more importantly, the trend-line rising up from 2011.
US Dollar Index: Monthly

With the euro sporting a 57% weighting in the DXY index, the outlook is unsurprisingly a near mirror-image for the single-currency. In October and November, we saw an important test of the top of the 2015-2017 range (old resistance turns into new support). The 2017 high arrived right around the 2012 low and will need to be exceed before a run gan gather momentum. If the euro can firmly trade above this threshold, then the 2008 to current trend-line near 12500 is the next targeted objective. On the downside, a break below 11554 will bring caution to longs, but it won’t be until we see a firm drop back inside the 2015-2017 range that a firmly bearish stance will be warranted. Support down to around 11400 is strong. A near record-long position (near 2007 levels) held by large speculators hints at a saturated market, but until price action turns bearish it’s only a secondary concern.
EUR/USD: Weekly

Start boosting your knowedge today with DailyFX Trading Forecasts and Guides
YEN
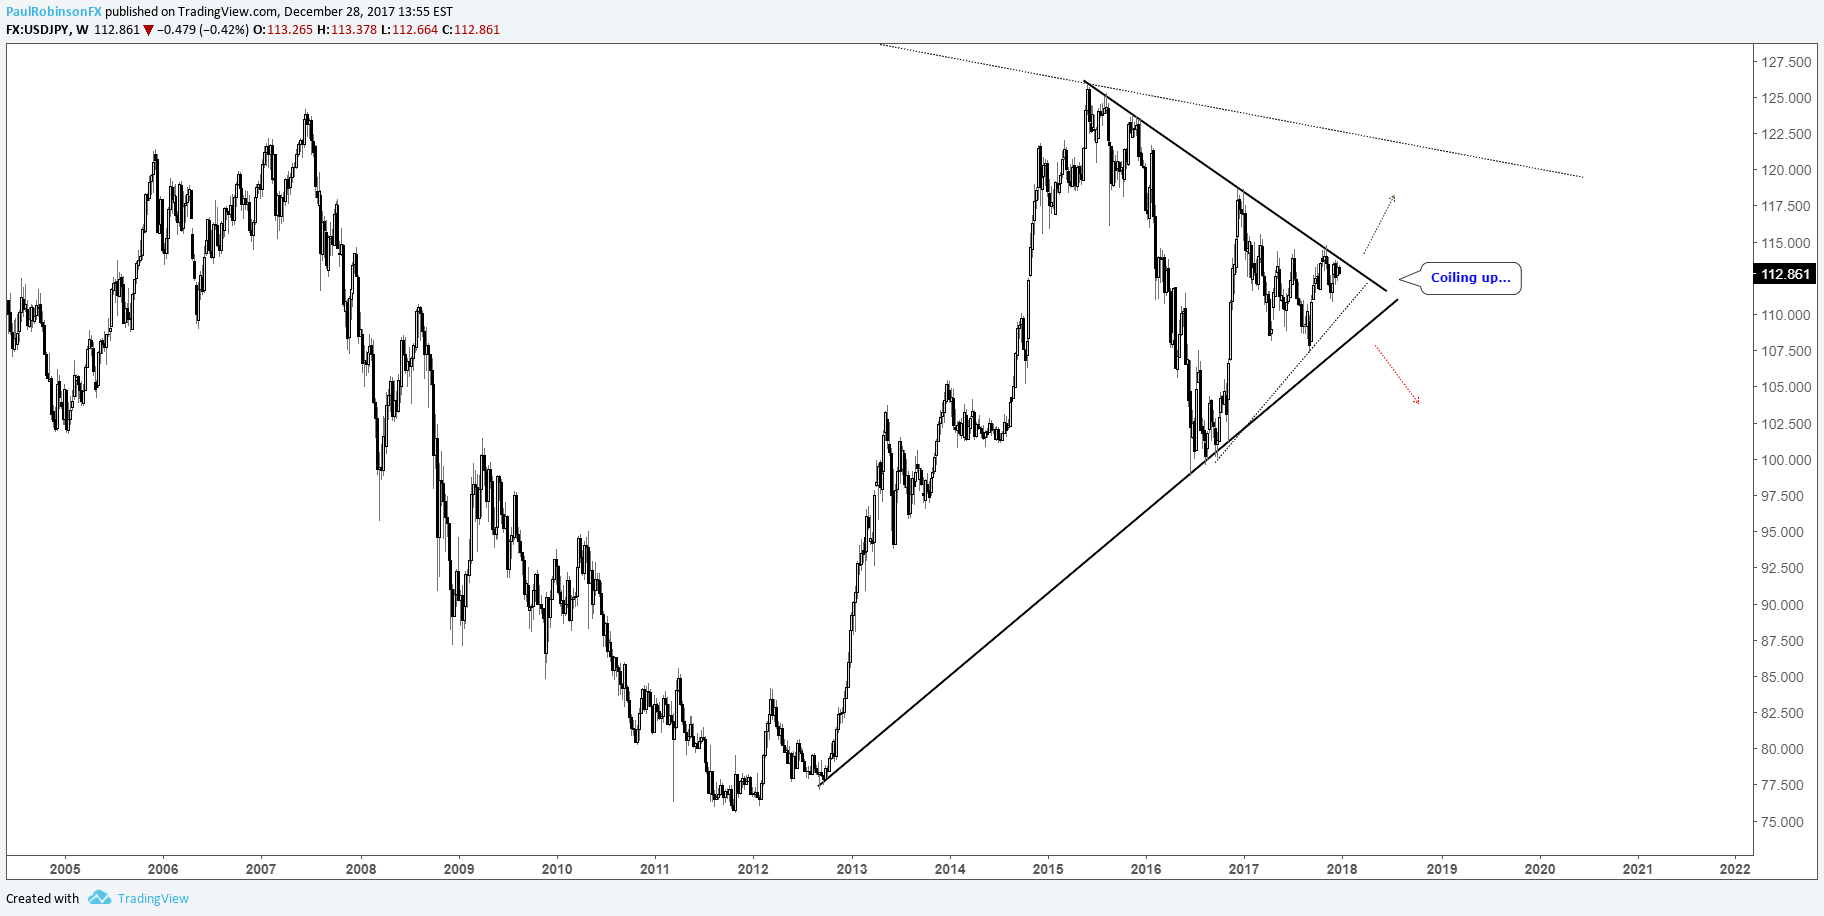
USD/JPY continues to sport a neutral posture, with 2017 resulting in a relatively tight range. There is a trend-line extending higher from 2012 penciled in as support, while the 2015 to current trend-line is resistance. We may see further coiling from USD/JPY before a breakout, but it could be rather significant after a quiet year (especially if we see an uptick in stock market volatility). Of more interest are the yen-crosses, where more clarity in trend and price behavior can be seen.
USD/JPY: Weekly
EUR/JPY put in one of the tightest ranges you can find in a very long time, where for over three months it moved in a ~300 pip range. It began to sneak out of that range last week. Levels to watch on the top-side include 13744, 13900, and 14102. A sharp drop lower through the bottom of the range could shift momentum significantly, but at this time that isn’t viewed as a high probability scenario.
EUR/JPY: Weekly

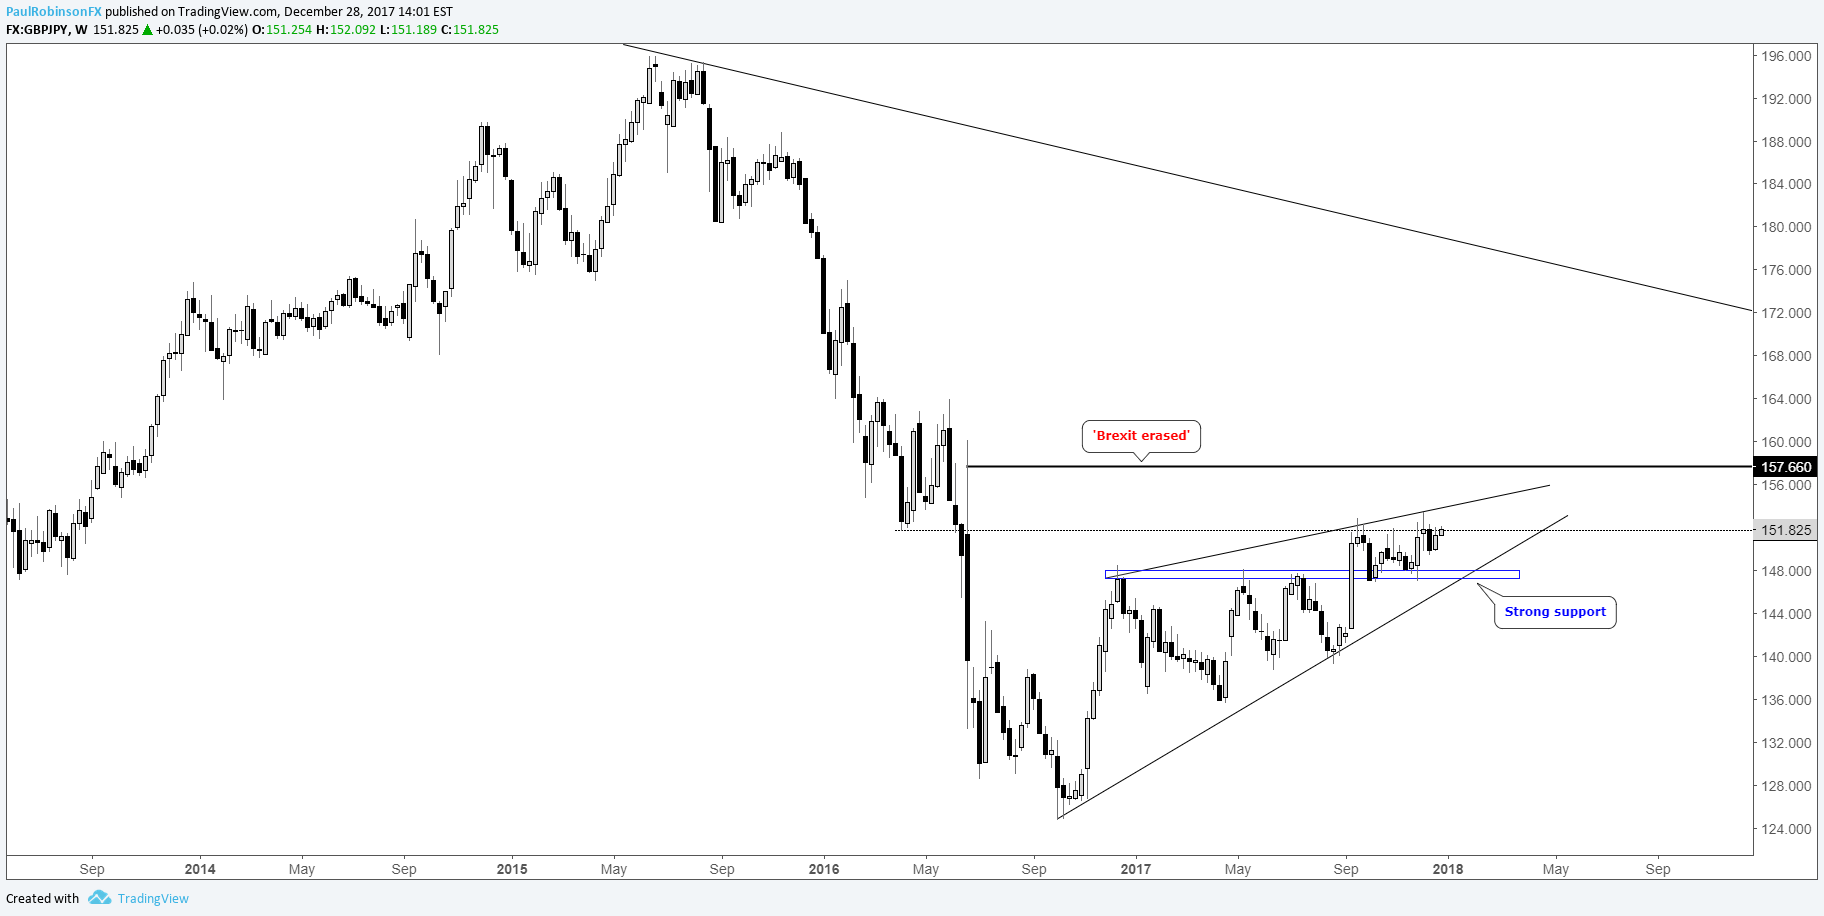
GBP/JPY is poised to erase all losses experienced as a result of the ‘Brexit’ vote. The trend off the 2016 low is higher, and in recent weeks we saw a thorough test of big support in the 14700s. On weakness, this major horizontal threshold could be in confluence with the trend-line off the 2016 low. Trend and support suggest it will hold. It will take a break of both angles of support to turn the outlook bearish. A larger ascending wedge could come into play at some point, but its an event we will need to revisit later if it becomes relevant.
GBP/JPY: Weekly
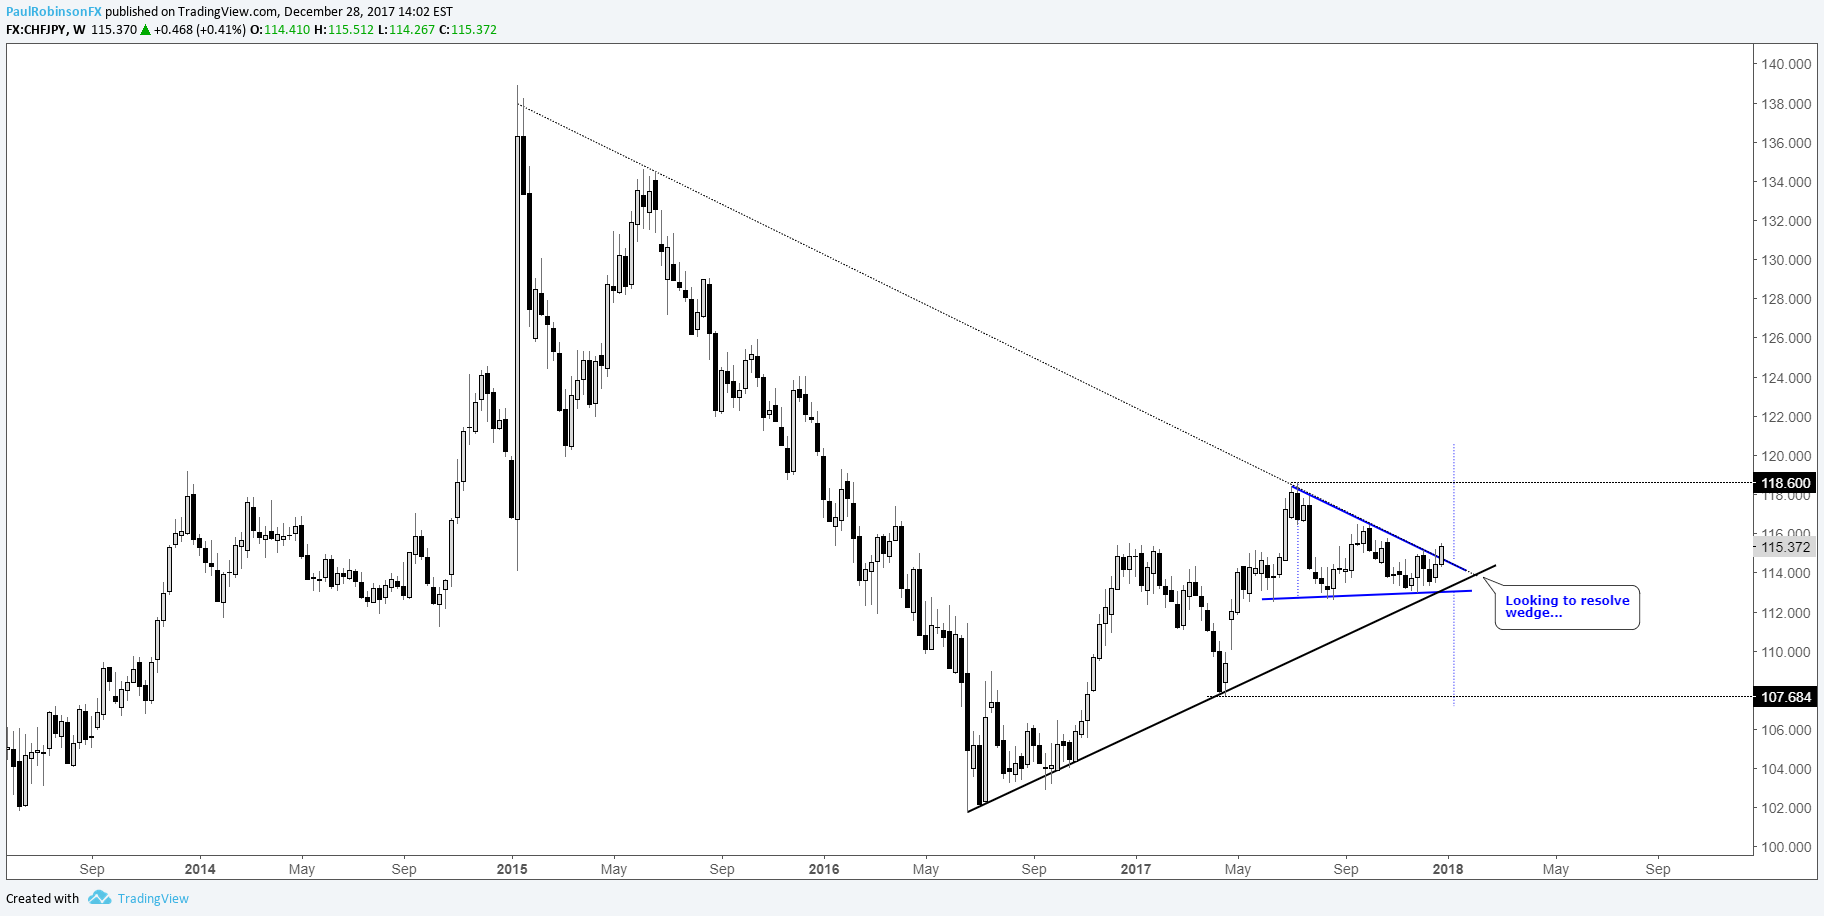
CHF/JPY is currently working on a bullish breakout from from a multi-month wedge. The top of the wedge is also in confluence with a trend-line running down off the 2015 high. The height of the pattern implies a measured move of about 600 pips from the point of breakout; if the rally can build from here that implies a target of 12000+. In the less probable event we see a fake-out breakout turn lower and take out the bottom of the wedge and 2016 trend-line, an equally-sized or bigger move could develop.
CHF/JPY: Weekly
GOLD
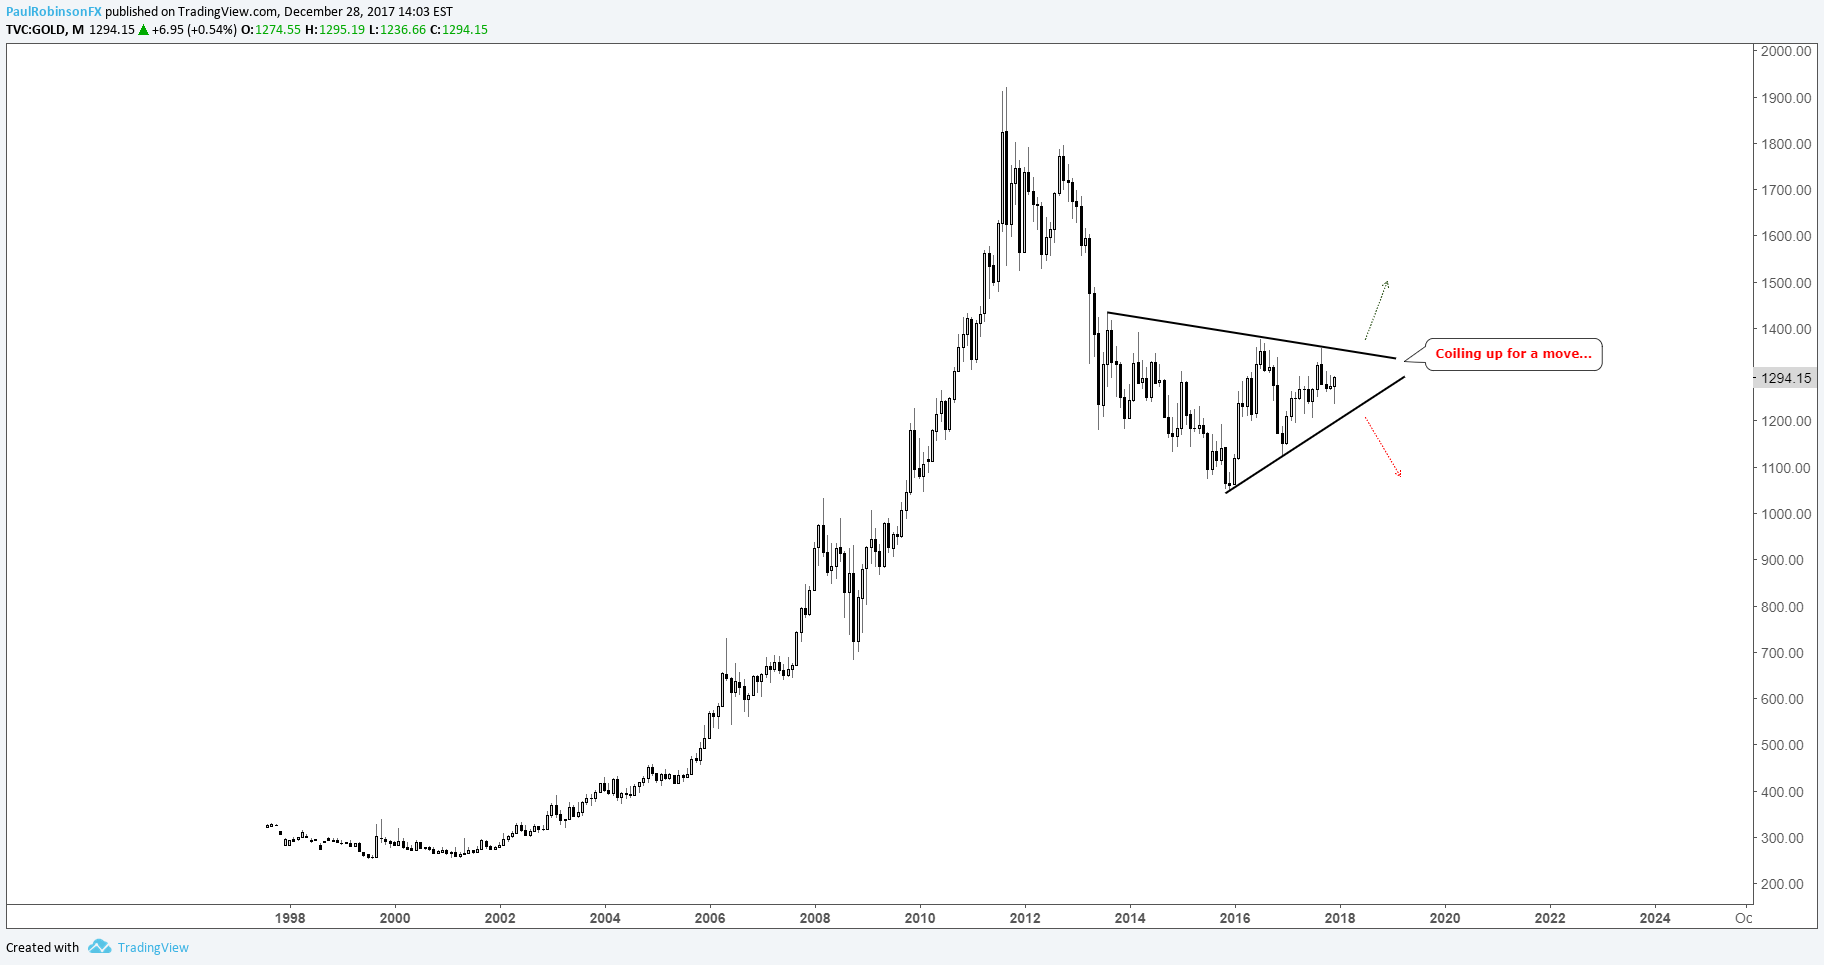
The past 3+ years gold has experienced price action contraction, which is bringing the precious metal towards a point in time when that contraction is likely to turn into expansion. Will it be up or down, is of course the big question. For now, it is mostly a guessing game as it sits in the middle of the narrowing range, but should we see momentum start to build in one direction or the other we could see a rather sizable move of $300-400 or more. A breakout above the July high at 1377 would be considered rather significant while a break below 1124 could quickly bring 1000 or worse into play.
Gold: Monthly
DAX
Broadly speaking, what is liked about the long-term DAX chart is the continuity of the channeling bull-market-move off the 2016 low. It has been a relatively orderly rally and would be much further along had it not been for the surging euro during 2017. The bottom line is this – stay within the confines of the channel and the bull market remains well intact. Drop below the underside of the channel and that tune could quickly change, especially on the development of a lower-low below the August low at 11868. Top-side levels to watch clock in at the record high at 13525, then the long-term bull-market channel line around 13900. The upper parallel of the channel off the 2007 peak connects with the 2009 low (both extremely important connecting points), and as such the DAX could find difficulty to rally beyond that point.
DAX: Weekly
Join Paul weekly for live each week (typically short-term technical analysis), please see the Webinar Calendar for details.
---Written by Paul Robinson, Market Analyst
To receive Paul’s analysis directly via email, please SIGN UP HERE
You can follow Paul on Twitter at @PaulRobinsonFX


