


What’s inside:
- One-week implied volatility trading at 7.97% while one-month is at 9.18%
- Trading range reflects the lack of volatility and expectations
- Key-reversal on failed breakout at resistance signals an increased likelihood of a downside break
Find out in our Q4 Forecast what is expected to drive the FX market through year-end.
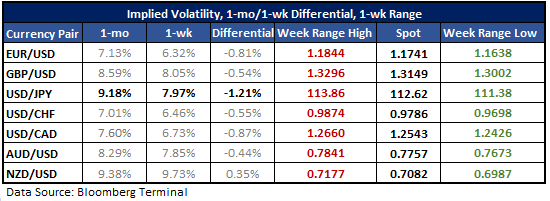
USDJPY short-term implied volatility may be underpricing a sustained breakout from the recent trading range; downside looks like the biggest risk at the moment.
When comparing 1-week to 1-month implied volatility the shorter dated options are pricing in less movement in USDJPY in the near-term than their longer-dated counterparts. One-month IV is at 9.18% while one-week is at only 7.97%. Volatility has been on the decline in recent weeks and the trading range in the Yen highlights this. The fact the currency has a ‘risk-on, risk-off’ component to it only helped push volatility lower as risk appetite for stocks has been strong, compacting volatility in major equity indices as evidenced by the CBOE VIX index (S&P 500) which continues to hover around 10.
But just as volatility has come down it can quickly go back up (that is the nature of volatility, mean-reverting). It's not just Yen, expectations for short-term volatility has dropped across the spectrum of major USD-pairs outside of NZDUSD, where 1-week IV is at 9.73% versus a 1-month level of 9.38%. But even there vol is coming down.
Moving ahead through the course of the next week we could soon see a sustained breakout in the recent range trading range. Friday’s attempt to break to the top-side failed, putting in a key-reversal bar at an intersection of the underside of the September trend-line (a consistent hurdle recently) and the trend-line running down off the March high. This could soon spell weakness for USDJPY, and if we see a pullback with any kind of force develop in stocks then look for the pair to come under additional pressure. In this case, we would look for the one-week one-standard deviation range-low at 11138 to be exceeded. Turning higher, the bearish reversal and resistance levels would need to be overcome for USDJPY to have a shot at trading up to the double-top from May and July.
Related events/data: The BoJ’s Kuroda will be speaking at 12:30 am GMT time on Tuesday; FOMC September meeting minutes on Wednesday; CPI, Advance Retail Sales, and UofM Confidence on Friday. For details, please see the economic calendar. North Korea/U.S. tensions flaring up is of course always a threat.
For other currency volatility-related articles please visit the Binaries page.
USDJPY: Daily

Join Paul live each week; for details please see the Webinar Calendar.
---Written by Paul Robinson, Market Analyst
You can receive Paul’s analysis directly via email by signing up here.
You can follow Paul on Twitter at @PaulRobinonFX.


