


- US Dollar and Japanese Yen have broken sharply above key price resistance
- We highlight further targets for USD and JPY pairs in the charts below
- See more information on DailyFX on the Real Volume and Transactions indicators
Receive the Weekly Volume at Price report via PDF via David’s e-mail distribution list.
The US Dollar and Japanese Yen have broken sharply higher versus the Euro and British Pound. Here are the levels we’re watching next.
Total Buy Volume Executed, Total Sell Volume Executed, Net Volume Executed (Buy-Sell)
Length of bar indicates the sum of Buy and Sell volume.
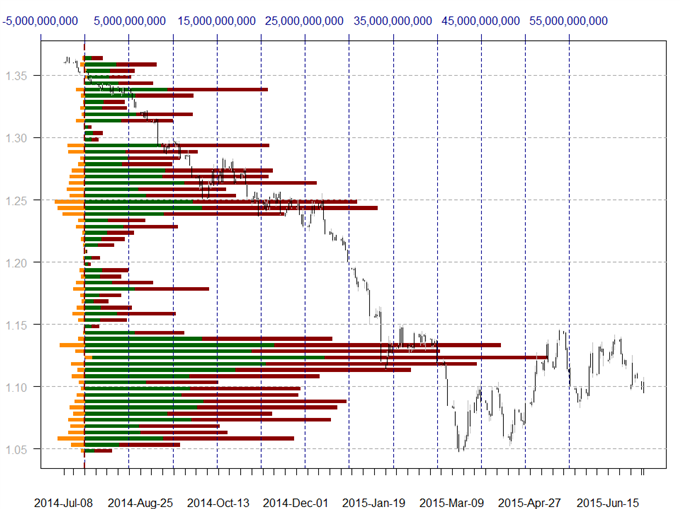
Data source: FXCM Real Directional Volume Indicator, Chart source: R. Prepared by David Rodriguez
The Euro has broken major levels of volume-based support and currently trades just above noteworthy congestion near $1.0900. A larger breakdown leaves little in the way of a test of $1.08, while former support is current resistance starting at $1.10 and extending through $1.12.
Total Buy Volume Executed, Total Sell Volume Executed, Net Volume Executed (Buy-Sell)
Length of bar indicates the sum of Buy and Sell volume.

Data source: FXCM Real Directional Volume Indicator, Chart source: R. Prepared by David Rodriguez
The British Pound has broken sharply below key support at the 1.5650 mark and now hovers just above notable congestion near $1.5400. A larger breakdown exposes a move towards June lows of $1.5200, while former support is now resistance starting at $1.5600.
Total Buy Volume Executed, Total Sell Volume Executed, Net Volume Executed (Buy-Sell)
Length of bar indicates the sum of Buy and Sell volume.
Data source: FXCM Real Directional Volume Indicator, Chart source: R. Prepared by David Rodriguez
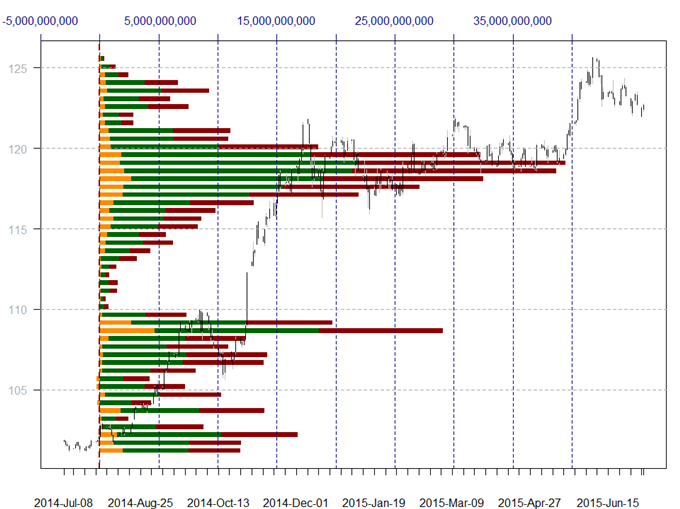
The US Dollar has continued to fail at notable congestion in the ¥123.50-¥124.50 range, and a failure has likewise taken it below recent lows of ¥122.60. Further volume-based support at ¥121.50, but trading below leaves major congestion near ¥119 as the next level to watch.
Total Buy Volume Executed, Total Sell Volume Executed, Net Volume Executed (Buy-Sell)
Length of bar indicates the sum of Buy and Sell volume.

Data source: FXCM Real Directional Volume Indicator, Chart source: R. Prepared by David Rodriguez
The Australian Dollar has broken sharply below all notable volume-based support levels, and our trading bias remains in favor of selling until we see a meaningful rebound. Former congestion highs from January, 2009 offer near-term price targets at $0.7250, but there remains little noteworthy support until the psychologically significant $0.7000 level. Resistance is former support in the $0.7600-0.7650 zone.
Total Buy Volume Executed, Total Sell Volume Executed, Net Volume Executed (Buy-Sell)
Length of bar indicates the sum of Buy and Sell volume.
Data source: FXCM Real Directional Volume Indicator, Chart source: R. Prepared by David Rodriguez
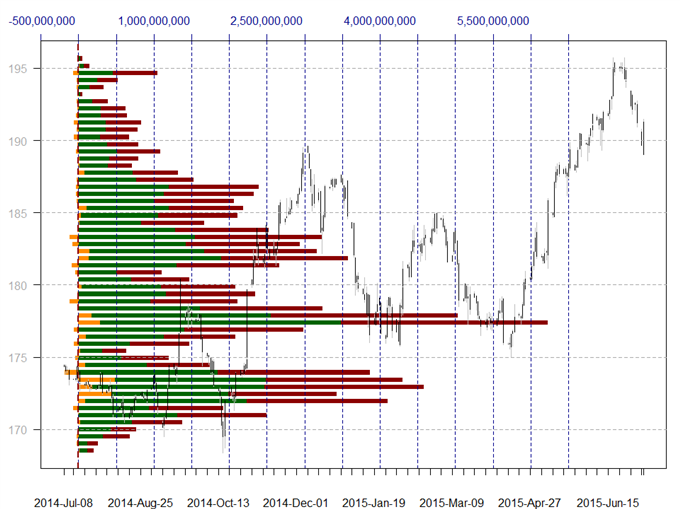
The Sterling has traded below important congestion versus the Yen at the ¥190 level, and support is now seen at December, 2014 highs near ¥188—likewise an important volume-based congestion zone. Our focus remains to the downside, and former support turns to resistance starting near ¥190.
Total Buy Volume Executed, Total Sell Volume Executed, Net Volume Executed (Buy-Sell)
Length of bar indicates the sum of Buy and Sell volume.

Data source: FXCM Real Directional Volume Indicator, Chart source: R. Prepared by David Rodriguez
The Euro has broken below key volume-based support versus the Yen near ¥135, and further support is now seen at May lows near ¥132. Former price floors now turn into a near-term ceiling at ¥135 as our focus remains to the downside.
Total Buy Volume Executed, Total Sell Volume Executed, Net Volume Executed (Buy-Sell)
Length of bar indicates the sum of Buy and Sell volume.

Data source: FXCM Real Directional Volume Indicator, Chart source: R. Prepared by David Rodriguez
The US Dollar bounced off of important support versus the Swiss Franc near the SFr0.9300 mark, and focus now turns to significant volume and price-based resistance starting at 0.9500. Trading above said level would target a move towards April highs near SFr 0.9700, while support is seen at recent congestion lows starting at 0.9200.
Total Buy Volume Executed, Total Sell Volume Executed, Net Volume Executed (Buy-Sell)
Length of bar indicates the sum of Buy and Sell volume.

Data source: FXCM Real Directional Volume Indicator, Chart source: R. Prepared by David Rodriguez
The US Dollar has broken convincingly above major volume and price-based resistance near C$1.2450 versus the Canadian Dollar, and our next upside target becomes post-financial-crisis highs near 1.2800. Former resistance is now support at the 1.2450 level.
NZDUSD
Total Buy Volume Executed, Total Sell Volume Executed, Net Volume Executed (Buy-Sell)
Length of bar indicates the sum of Buy and Sell volume.

Data source: FXCM Real Directional Volume Indicator, Chart source: R. Prepared by David Rodriguez
The New Zealand Dollar has traded below all notable volume-based support levels has also broken July, 2010 lows near $0.6800. The next level of support is now seen at the May, 2010 trough of $0.6550, while trading below leaves few comparable price floors until the psychologically significant 0.6500 mark.
Total Buy Volume Executed, Total Sell Volume Executed, Net Volume Executed (Buy-Sell)
Length of bar indicates the sum of Buy and Sell volume.

Data source: FXCM Real Directional Volume Indicator, Chart source: R. Prepared by David Rodriguez
The Australian Dollar has broken below all notable volume-based support versus the Japanese Yen, and further downside targets are now the psychologically significant ¥90 mark and January, 2014 lows of ¥88.40.
Total Buy Volume Executed, Total Sell Volume Executed, Net Volume Executed (Buy-Sell)
Length of bar indicates the sum of Buy and Sell volume.

Data source: FXCM Real Directional Volume Indicator, Chart source: R. Prepared by David Rodriguez
The EUR/AUD trades at significant spike-highs in the A$1.48-1.49 range, and a break higher would leave few comparable price ceilings until 1.5350. Support remains at important volume-based price congestion starting above 1.4500.
Total Buy Volume Executed, Total Sell Volume Executed, Net Volume Executed (Buy-Sell)
Length of bar indicates the sum of Buy and Sell volume.

Data source: FXCM Real Directional Volume Indicator, Chart source: R. Prepared by David Rodriguez
The Euro/Sterling trades has held important psychological support at the £0.70, but it has thus far failed to trade to support-turned-resistance starting in the £0.7150-0.7200 range. Focus remains lower absent a break above the key price ceiling.
--- Written by David Rodriguez, Quantitative Strategist for DailyFX.com
Receive the Weekly Volume at Price report via PDF via David’s e-mail distribution list.
Contact David via
Twitter at http://www.twitter.com/DRodriguezFX


