


Indices Technical Forecast: Bearish
- I covered the fundamental side of equities in the fundamental forecast for next week.
- In this article I’ll focus primarily on the technical side of the equation, with focus on weekly and daily charts of the S&P 500, Nasdaq and Dow.
- The analysis contained in article relies on price action and chart formations. To learn more about price action or chart patterns, check out our DailyFX Education section.

It was a bad week for stocks as all of the S&P 500, Nasdaq and Dow Jones produced bearish engulfing patterns. Coming into the week, each index retained a bullish near-term backdrop as prices had pushed up to fresh near-term highs in the week prior, and those moves extended in the early-portion of last week. But, the CPI release on Tuesday helped to change that.
I looked into this on Tuesday afternoon, highlighting how there was a mirror image of the response to CPI in October. On October 13th, two months to the day of last week’s CPI release, inflation printed above expectations and brought a quick jolt of fear into the equation. Stocks sold off initially, but soon found support and started to rally, thereby exposing a long lower wick underneath that daily candle. And then for the next two months buyers prodded the rally-higher, all the way until the 2022 bearish trendline came in to hold the highs in early-December.
That trendline was breached on Tuesday, albeit temporarily, before sellers slammed price back below that level, and then they continued to run through the FOMC meeting on Wednesday and caught another wind on Thursday, helping to breach key support as all three indices flung down to fresh monthly lows.
As I had written in last week’s forecast, I was expecting a failed breakout beyond that trendline, although the timing has happened more quickly than I anticipated. Price remains in the longer-term falling wedge for the S&P 500 that I had discussed last week, but it looks as though price may be making a move towards the lower-portion of that formation.
S&P 500 Weekly Price Chart
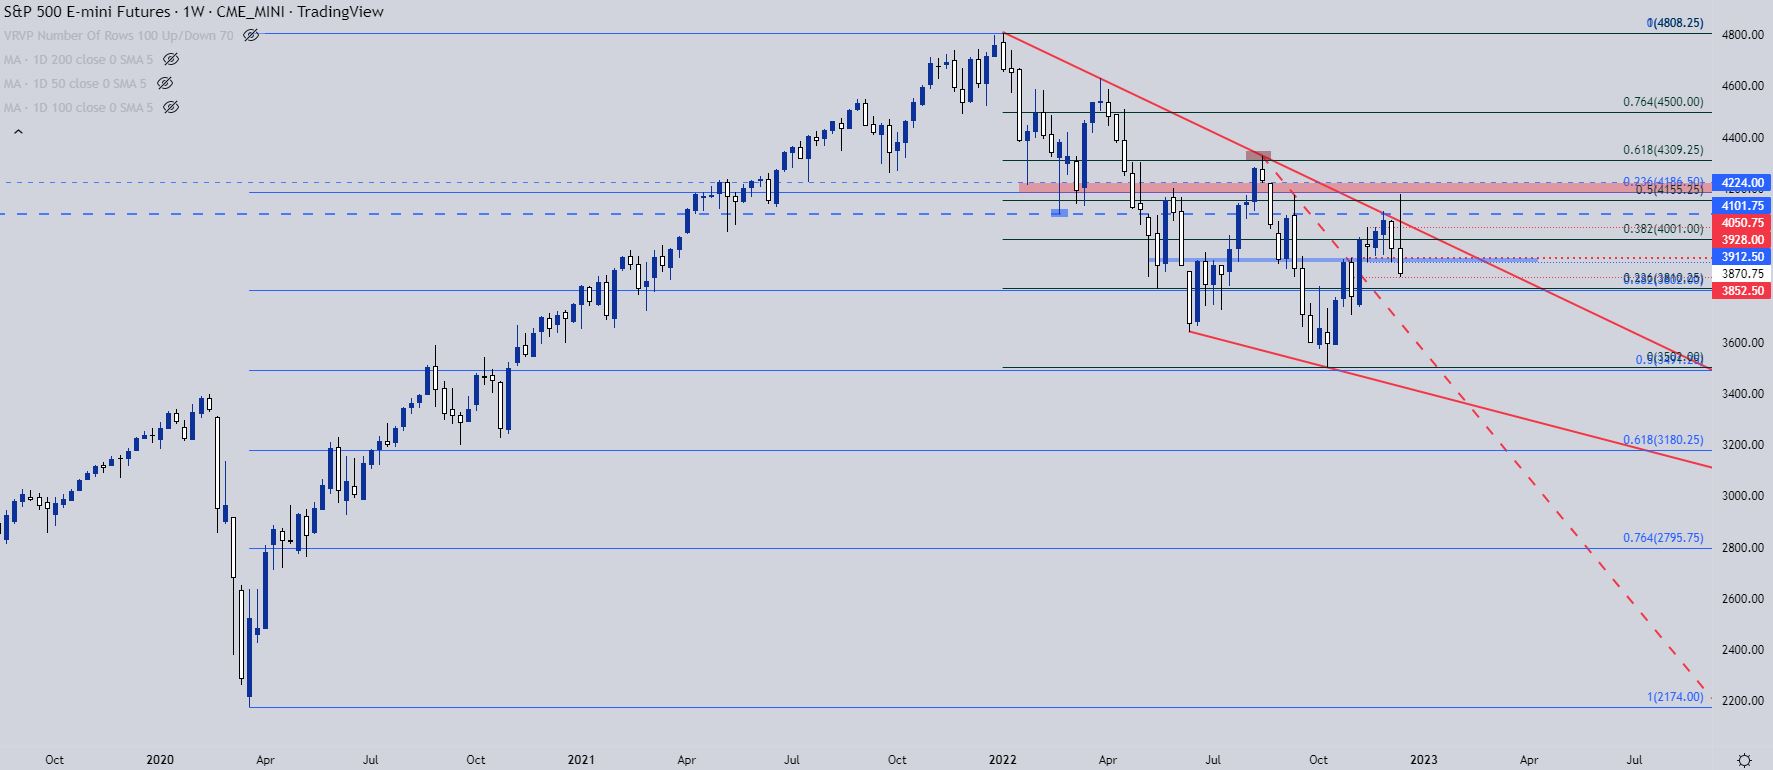
Chart prepared by James Stanley; S&P 500 on Tradingview
S&P 500 Levels
From the daily chart we can get a clear view of that push down to fresh monthly lows. The bearish response after the Tuesday CPI print has been aggressive, and the prior zone of support that runs from around 3912-3928 is now near-term resistance potential, after which the 4k level comes into the picture. For support, the next major area is around the 3800 level, which helped to set the May low and offered some resistance in October. There’s a confluent of Fibonacci levels in this area and if bears can force a breach, 3750 and then 3704 quickly come back into the picture.

S&P 500 Daily Price Chart
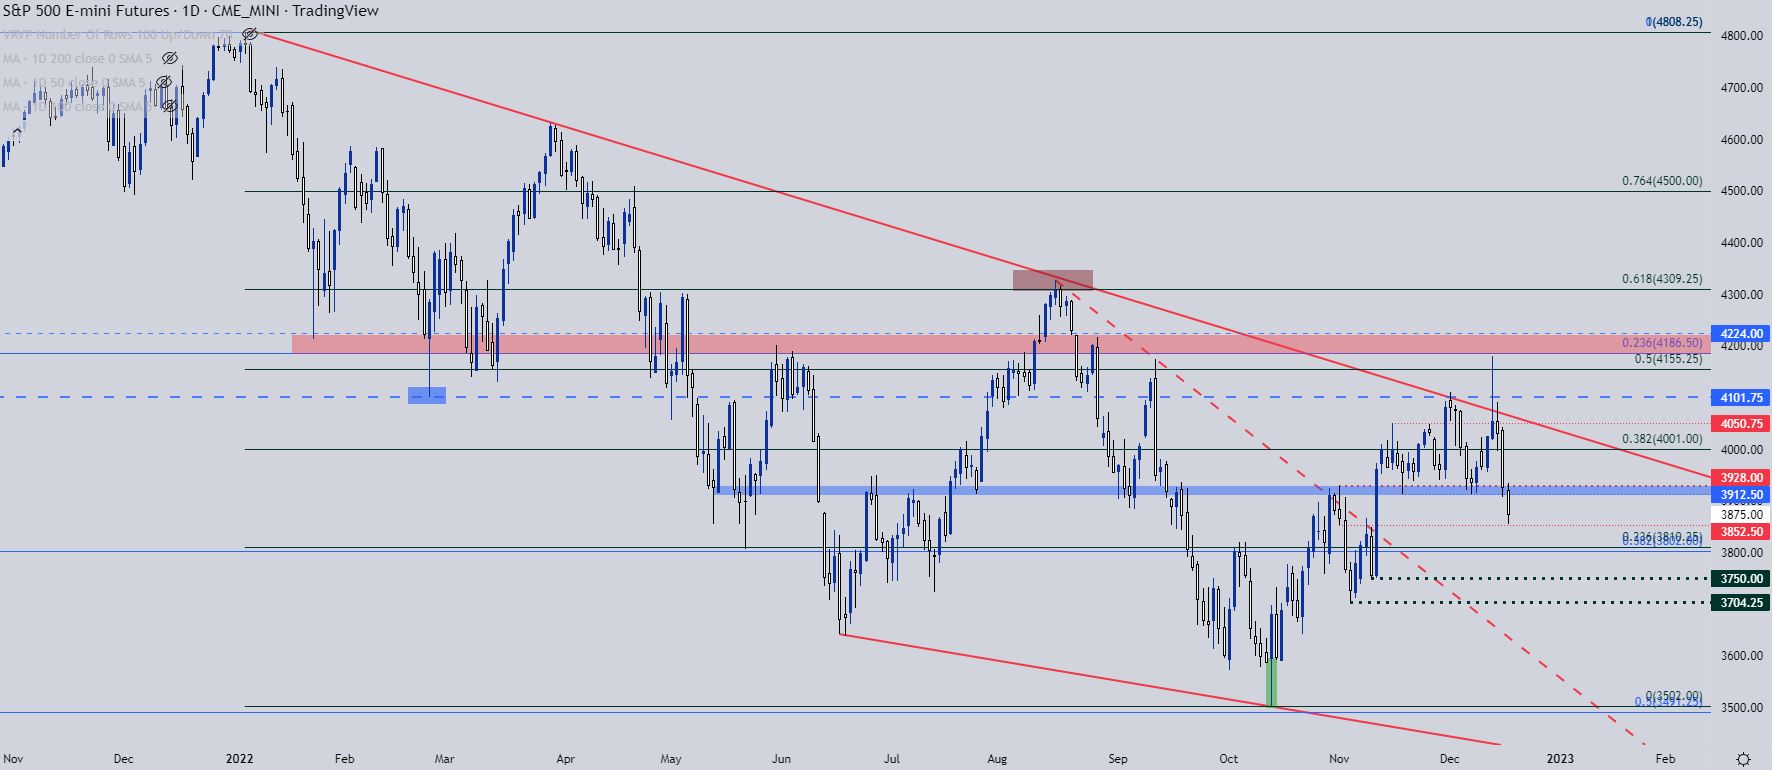
Chart prepared by James Stanley; S&P 500 on Tradingview
Nasdaq
The Nasdaq 100 fell down to the Fibonacci level at 11,294 to help hold the lows into the end of the week but, similarly, had a very bearish week that shifts the control back to sellers. The bigger question here in my mind is of a longer-term nature.
The Fibonacci retracement produced by the pandemic major move helped to mark the yearly low at 10,501. That’s the 61.8% retracement of that formation and the 50% marker of the same study has also been pretty important lately, plotted at around 11,700. That price had helped to set support for the four weeks prior, so the fact that bears were able to elicit a push below that level particularly after a failed breakout beyond the 2022 trendline, keeps the focus on the short side of the matter.
For next supports, I’m tracking 11,068 followed by 10,751 and then the 10,501 level. The big question that I have is whether those levels can come into play in the final couple weeks of the year or whether this will have to wait as an early-2023 theme.

Nasdaq 100 Weekly Chart
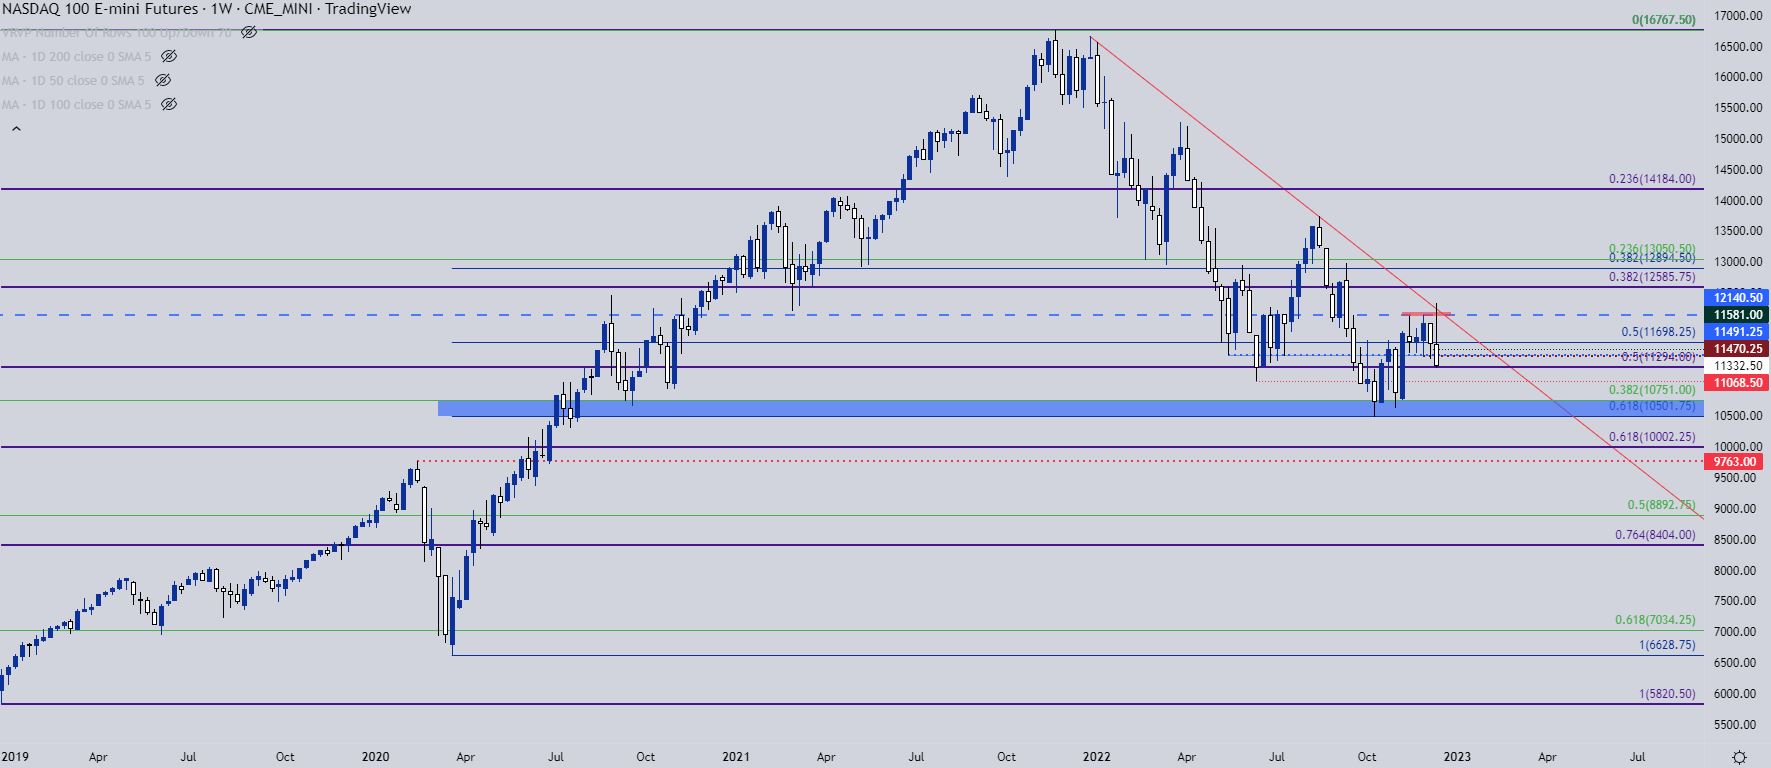
Chart prepared by James Stanley; Nasdaq 100 on Tradingview
The Dow
While both the S&P and Nasdaq set their yearly lows on October 13th, the Dow actually set a higher-low that morning. And as bulls came back in, the Dow led the way with a move that spanned as much as 23.2% in just a few short months. This clearly had the appearance of shorts being squeezed but it also seemed as though there was some legitimate accumulation taking place; and if we consider the higher rate backdrop that will likely be in the picture for 2023, it makes sense as to why blue chip equities could outperform tech, which is usually more rate sensitive.
The Dow had a rough week by printing a bearish engulf like the S&P and Nasdaq above; but from the daily chart there is still an argument to be made for bullish structure as price has support potential from a prior resistance trendline.
The 2023 trendline in the S&P 500 helped to snap price back last week and the same can be said for the Nasdaq. But the Dow still trades above that level and the projection of that trendline runs to around 32,789, which is a prior swing high from September 13th. A hold of support there could keep the door open for short-term bounce plays in the index. And for next resistance, prior support sticks out at around 33,444, after which 33.707 comes into the picture.

Dow Jones Daily Chart
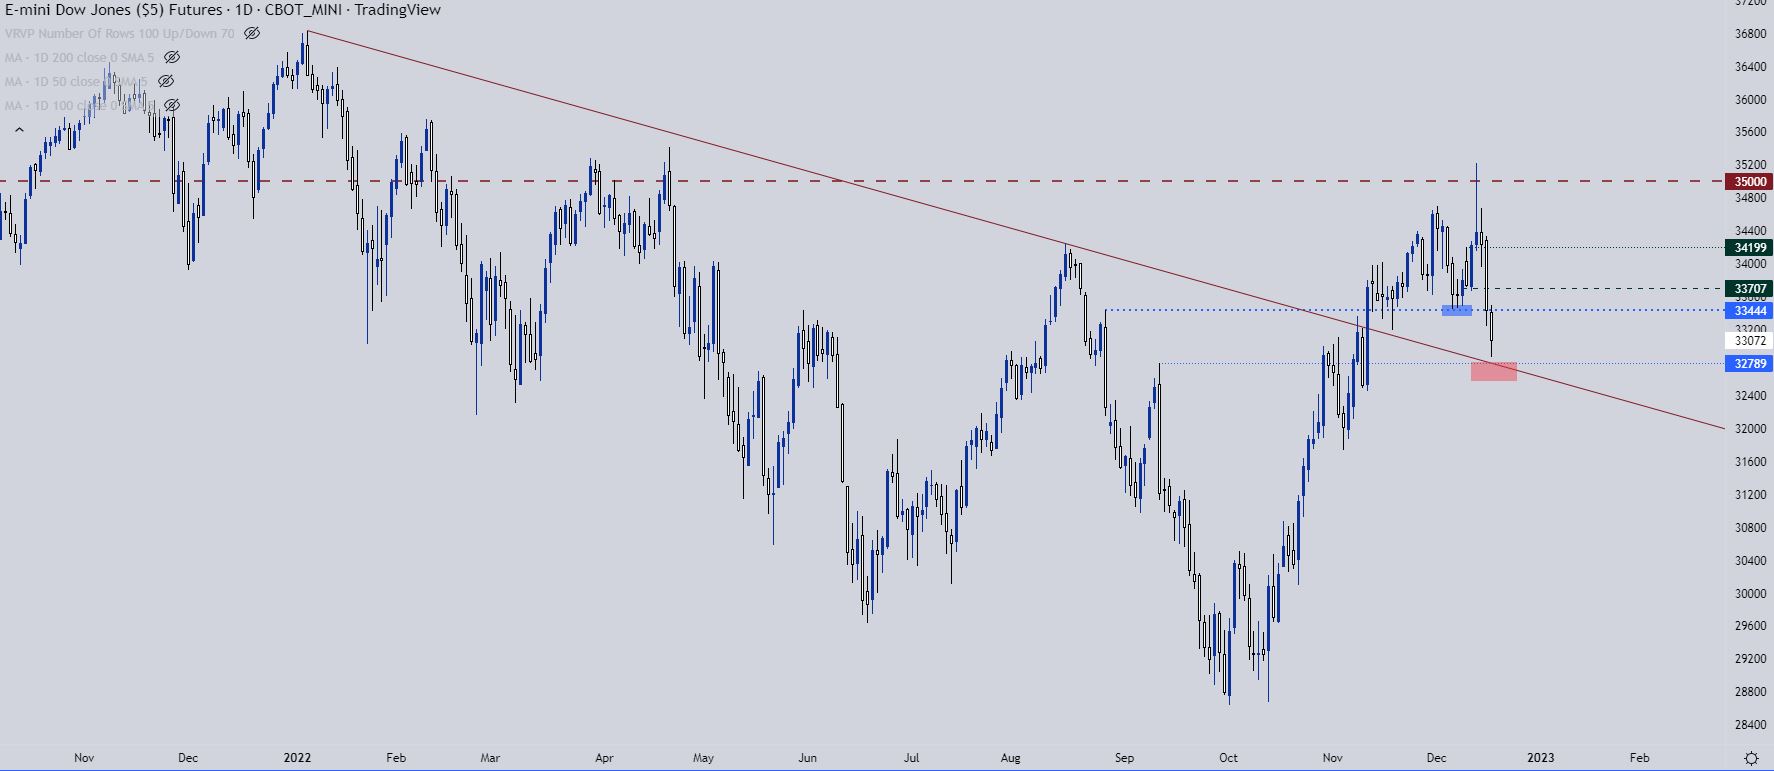
Chart prepared by James Stanley; Dow Jones on Tradingview
--- Written by James Stanley, Senior Strategist, DailyFX.com & Head of DailyFX Education
Contact and follow James on Twitter: @JStanleyFX


