


British Pound Technical Forecast: Neutral
- The British Pound took a hit during the Bank of England rate decision and press conference, as Andrew Bailey remarked that the U.K. is already in a recession and was on a ‘very challenging’ path ahead. A large portion of those Thursday losses were erased on Friday after another strong NFP report out of the US.
- GBP/USD, GBP/JPY and EUR/GBP all pushed to key support/resistance areas and those helped to hold the lows/highs into the end of the week. But, can those technical barriers be anything more than a speed-bump?
- The analysis contained in article relies on price action and chart formations. To learn more about price action or chart patterns, check out our DailyFX Education section.

It was a brutal week for the British Pound. Losses were pared a bit on Friday but, on net, weekly bars in GBP/USD, GBP/JPY and EUR/GBP all reflect varying degrees of Sterling weakness. It was the Thursday rate decision that really pushed the matter, as the Bank of England hiked rates by 75 basis points, their largest such move in over 33 years. But, they also warned of a ‘very challenging’ path ahead while remarking that the UK is already in a recession. The bank talked up a lower terminal rate and accordingly the British Pound fell in response, with GBP/USD and GBP/JPY pushing to some key support areas while EUR/GBP pushed back-up to range resistance.
While the fundamental backdrop remains bearish for the UK, the technical outlook for GBP/USD has some question marks which can mainly be attributed to the US Dollar. The Greenback has recently stumbled even in light of positive US data that denotes a continued path of hawkishness from the Fed. And this may be owed to the fact that the bullish trend in the US Dollar is somewhat crowded. And given the reaction to support this week, the forecast for the British Pound will be set to neutral.
With that being said – this is not to mean that there won’t be opportunity present, particularly if bulls can force a re-test of the 1.1500 psychological level which, earlier in the week, was being used as support as a descending triangle formation had built. Those setups are often tracked with the aim of bearish breakouts, and that started to fill during FOMC and quickly hastened the next morning through the Bank of England rate decision. I had highlighted that as part of the Monday article on US Dollar Price Action Setups but, by the time Thursday rolled around, I warned of support potential after a really large move in the pair.
GBP/USD Four Hour Chart
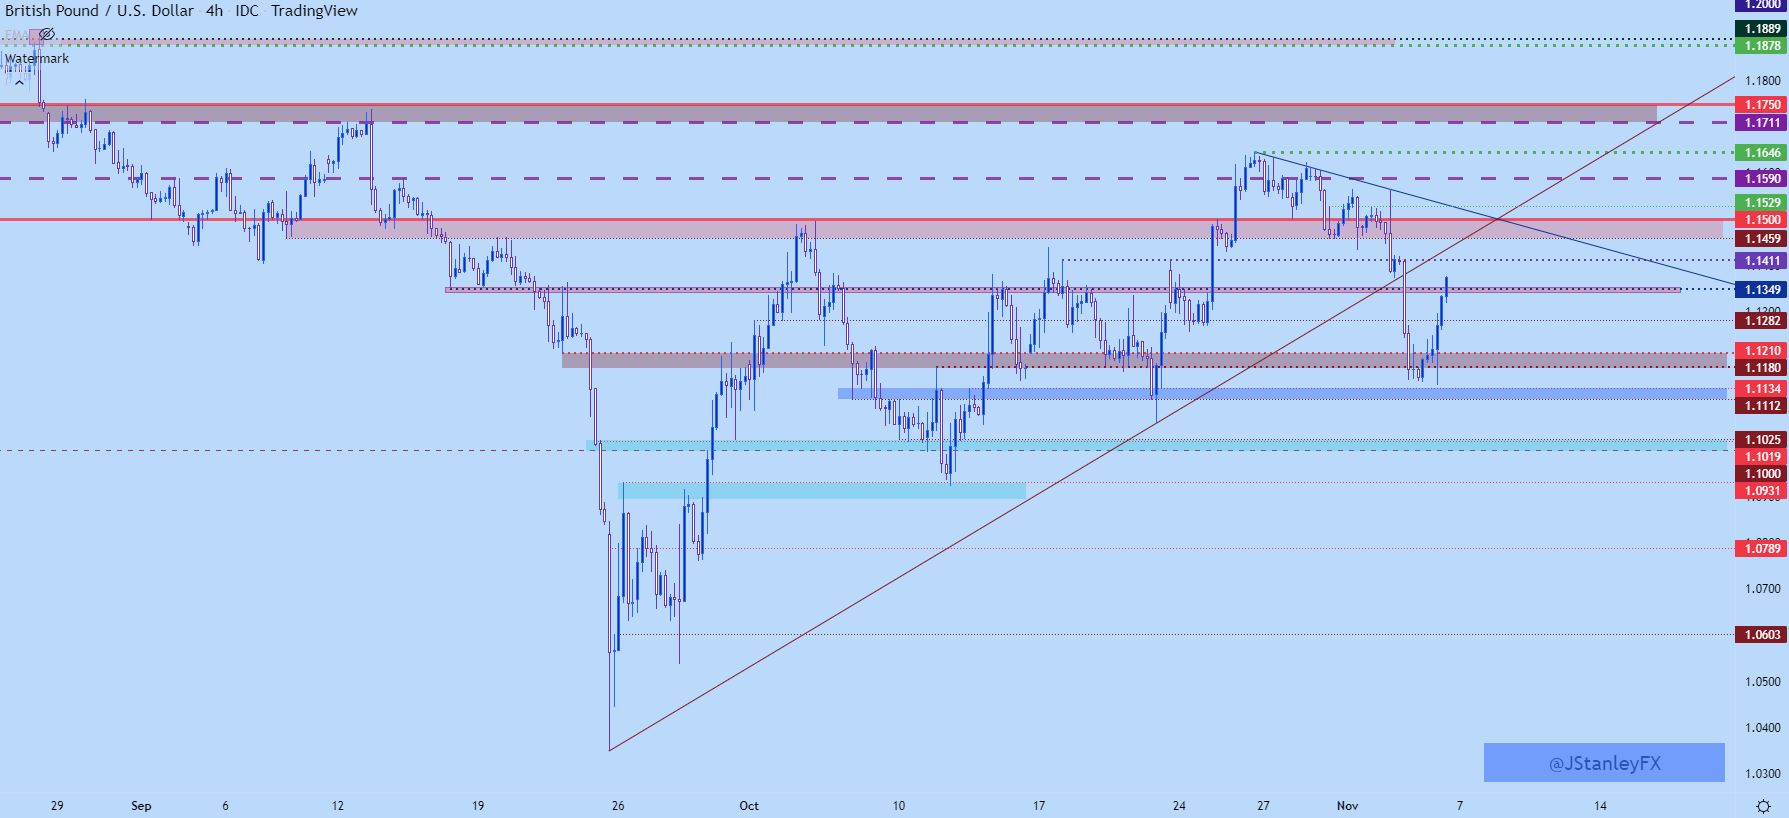
Chart prepared by James Stanley; GBPUSD on Tradingview
GBP/USD Longer-Term
From the daily chart, what’s more interesting to me than what happened this week is what didn’t. Even with an open door for prices to run down for a test of the 1.1000 handle, sellers pulled back and that led to a sizable move on Friday that erased the bulk of the Thursday sell-off. If bears really wanted to push the downside move – the door was open for it – and yet they didn’t walk through.
Again, this doesn’t necessarily spell bullishness, but it also puts that bearish move that built earlier in the week into scope, especially considering both the fact that the Fed came out as more hawkish and the BoE came out as more dovish. The fact that we have this divergence in price from the headlines indicates that the short side of the trade may still be a bit crowded.
Sellers had an open door and couldn’t do much with it, and this brings questions to bearish continuation potential, particularly the timing element of the matter.

GBP/USD Weekly Chart
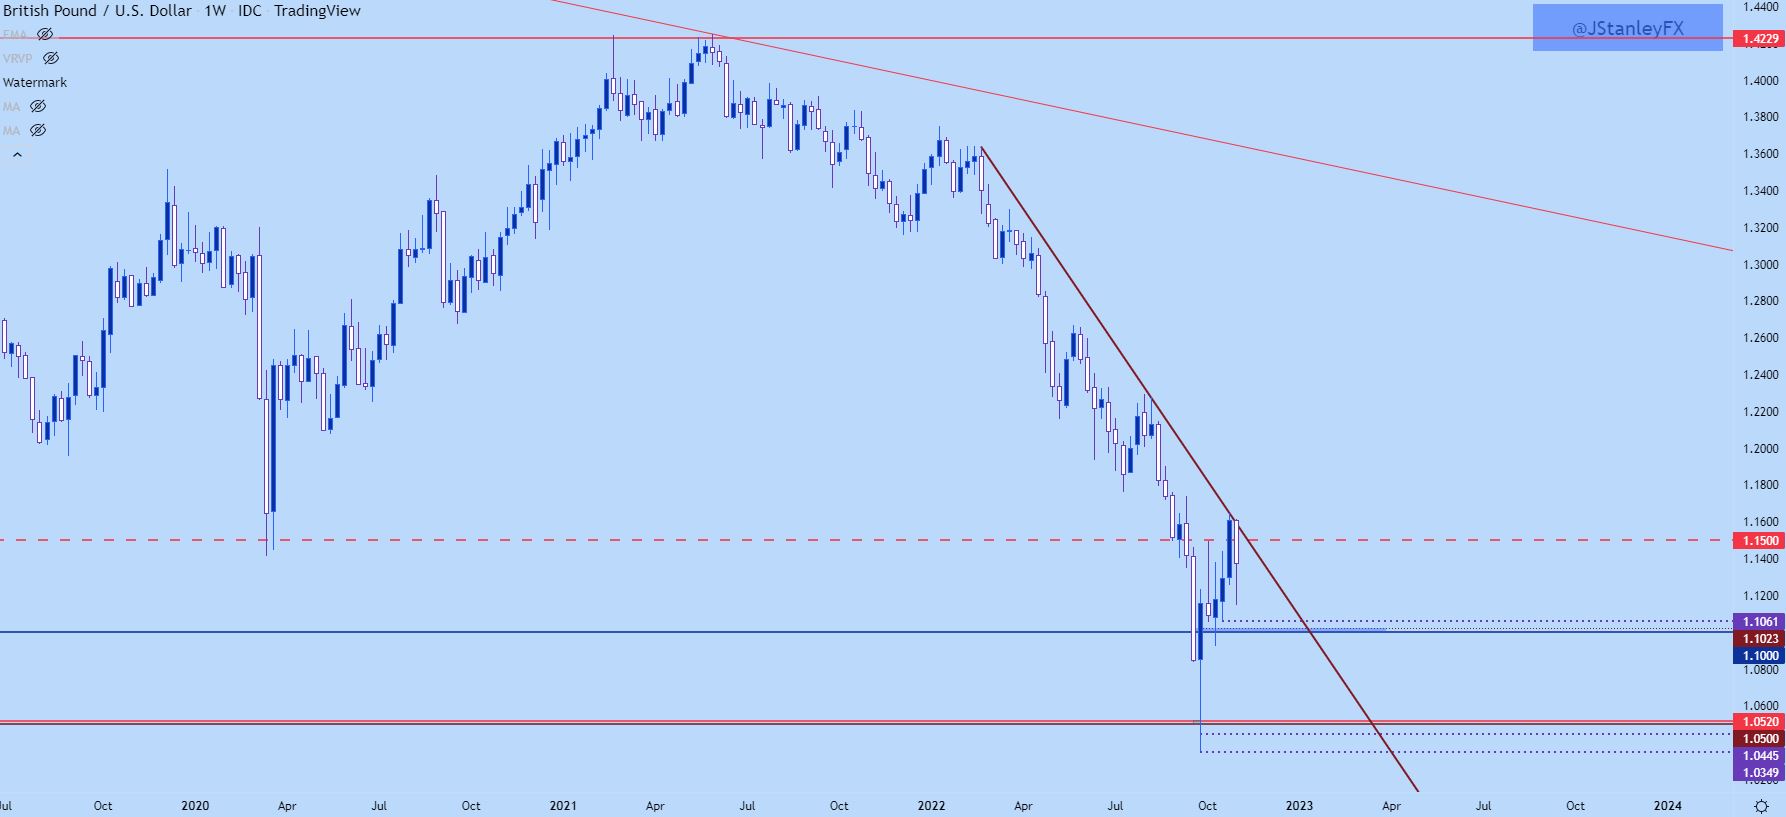
Chart prepared by James Stanley; GBPUSD on Tradingview
GBP/USD – Levels
The 1.1500 psychological level remains an obvious focal point for the pair. But, if buyers can bring that back into play in the early-portion of next week with a push above that price, the door can quickly re-open for tests of 1.1646 or perhaps even 1.1742.
GBP/USD Daily Price Chart
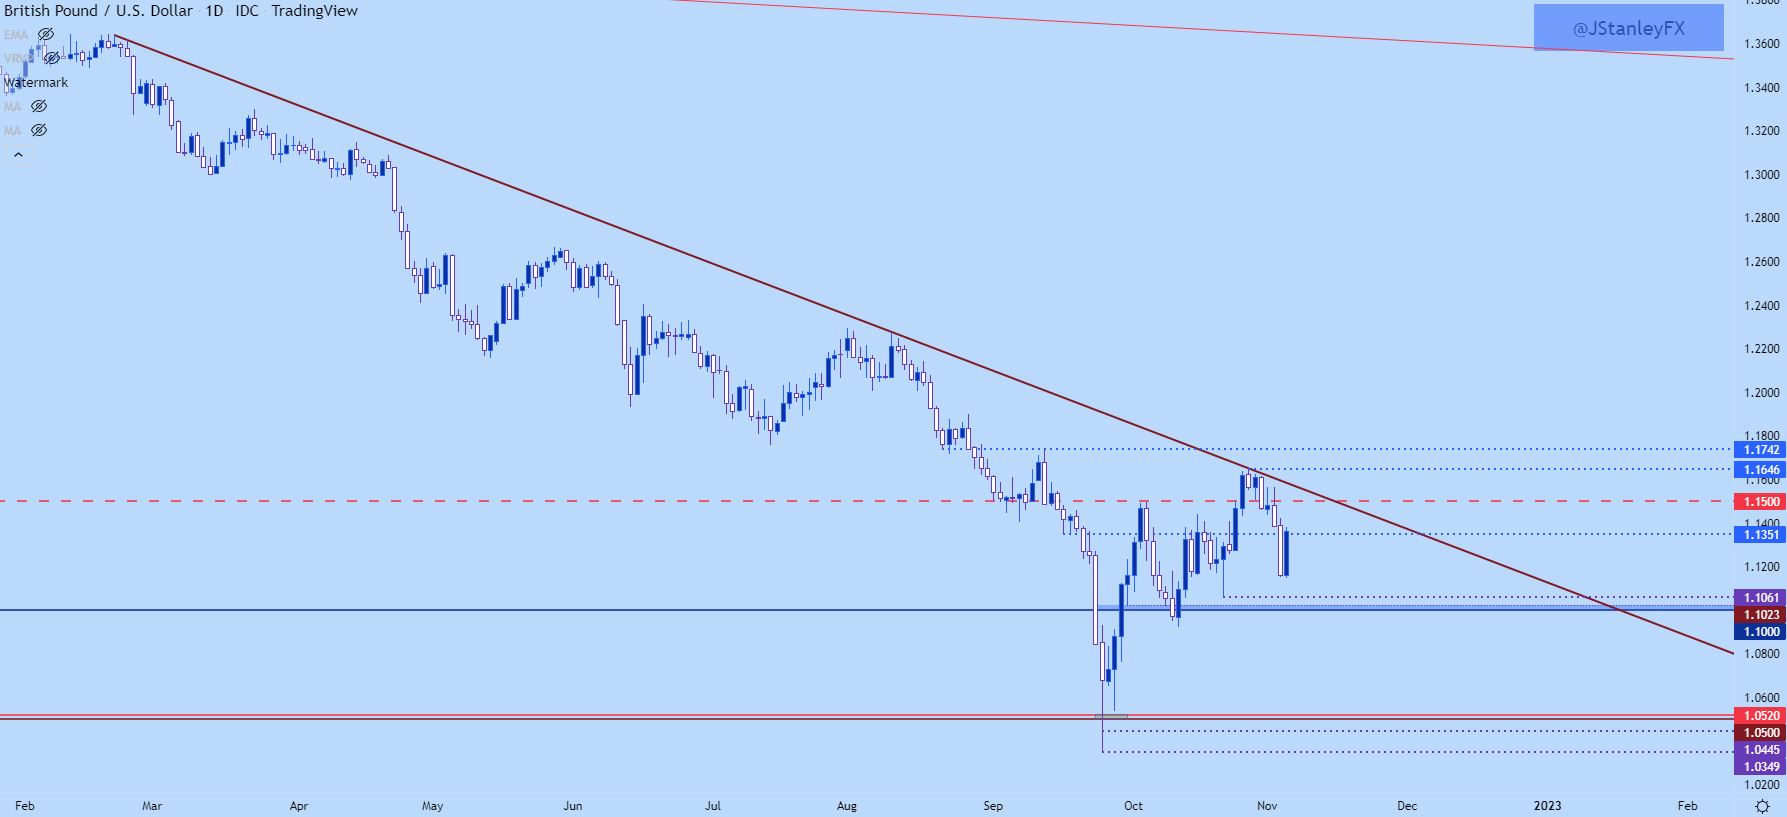
Chart prepared by James Stanley; GBPUSD on Tradingview
GBP/JPY
GBP/JPY may be more workable than GBP/USD in the current backdrop, and mainly in effort of avoiding USD-related themes. That’s not to say that the Japanese Yen has been any more consistent. But, from a technical basis, it has been cleaner in my point of view than what’s showed in GBP/USD over the past week.
After that Thursday sell-off, I highlighted a key zone of support that had started to come into play again in GBP/JPY. The bottom of the zone was the 165.00 psychological level, which both helped to set resistance in late-September and support in early-October. That price came back into the picture shortly after the BoE rate decision and price action grinded there for much of the next day, finally getting some lift late in the week as prices in the pair ran back to 167.00.

GBP/JPY Four Hour Price Chart
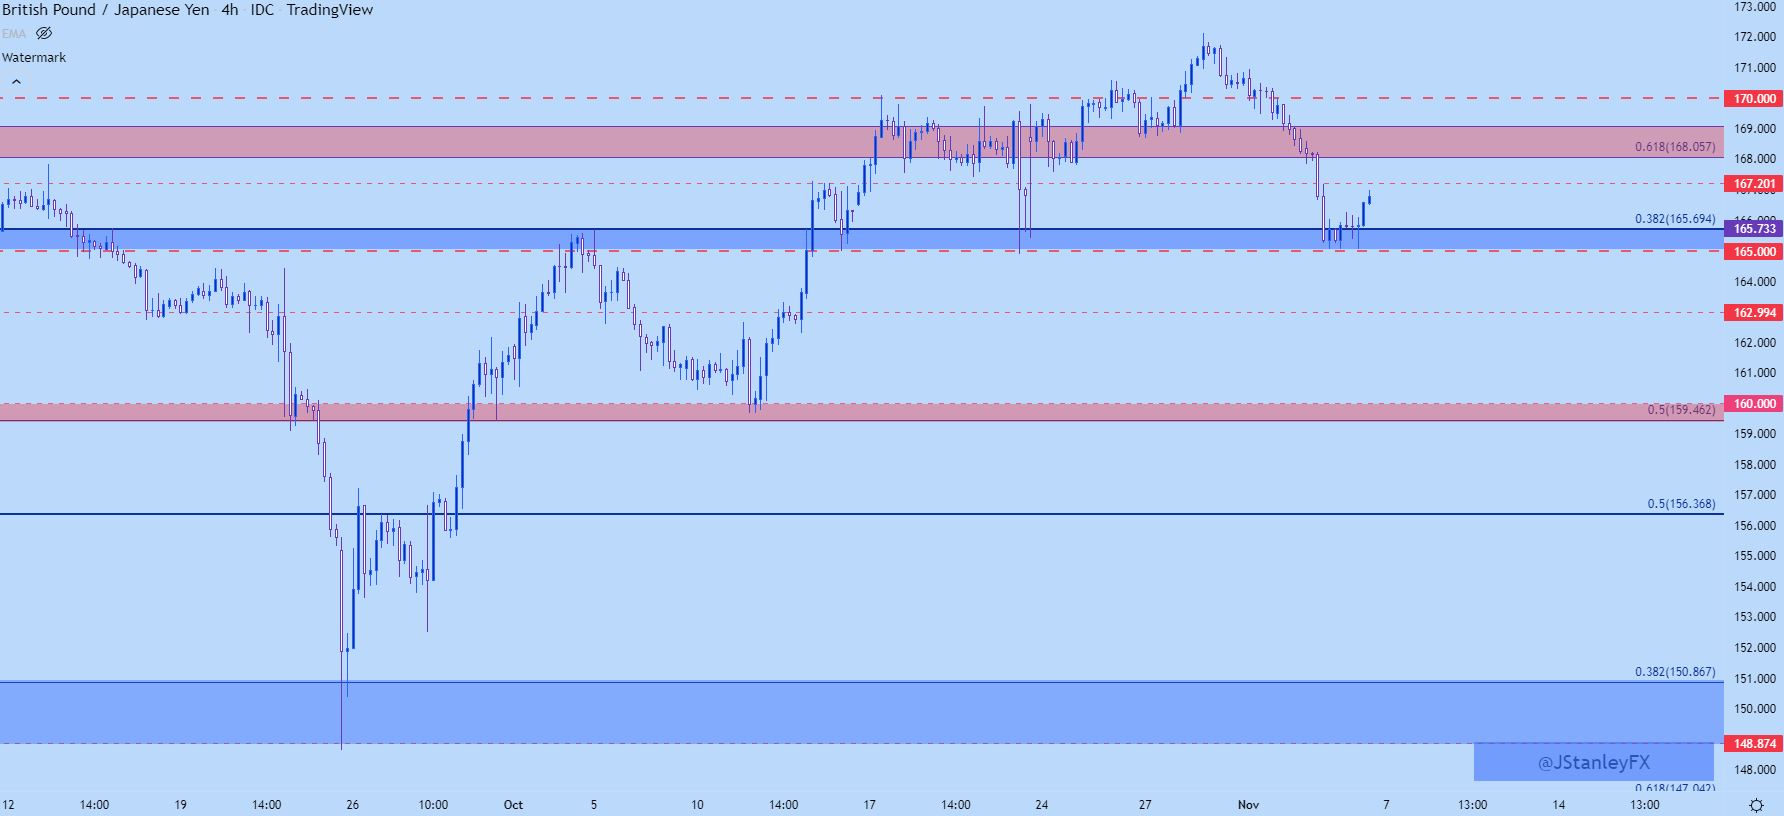
Chart prepared by James Stanley; GBPJPY on Tradingview
The weekly chart below shows what a contentious area this zone has been, as it has helped to set resistance for much of the past six months, until coming back into the picture as support over the past couple of weeks, helped along by a couple of nearby Fibonacci levels highlighting confluence.
GBP/JPY Weekly Price Chart
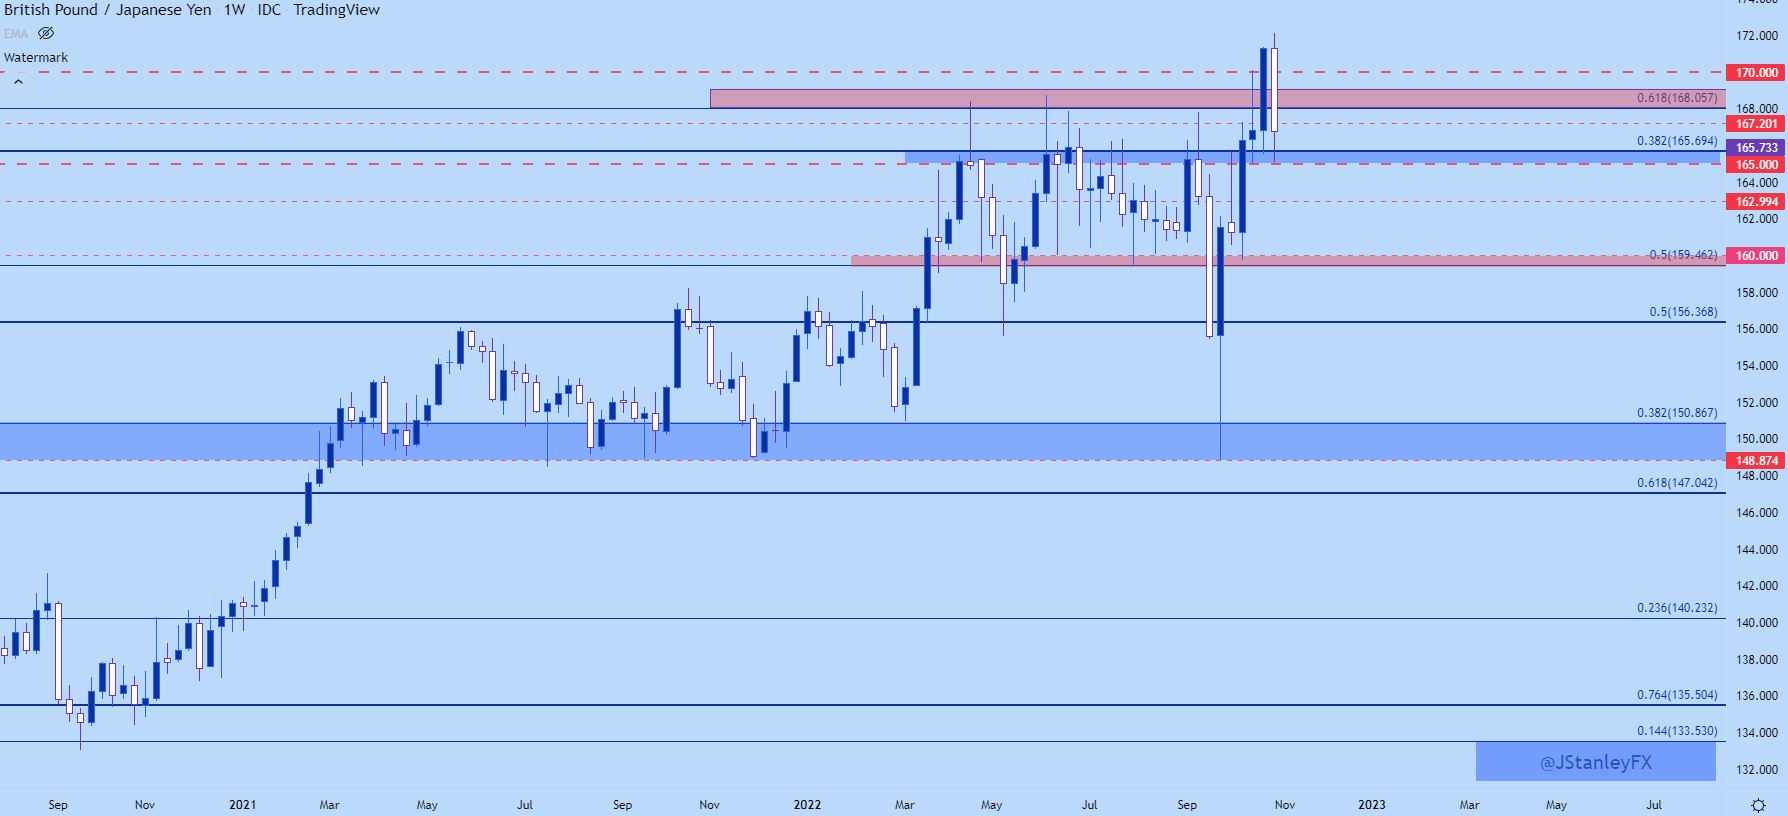
Chart prepared by James Stanley; GBPJPY on Tradingview
EUR/GBP
While EUR/GBP may not put in the same magnitude of moves that will often be seen in GBP/USD or GBP/JPY, there is still some brewing interest here, largely on the basis of a resistance test at a familiar area. The level of .8780 marks the recent high and this level came into play to catch the high again last week. This keeps the door open for bullish breakout potential so for those that are looking to press themes of Sterling weakness, this could be an area of interest to follow. For support, there’s a zone that runs from .8709 up to .8731 that can be tracked for higher-low support potential.
EUR/GBP Four-Hour Price Chart
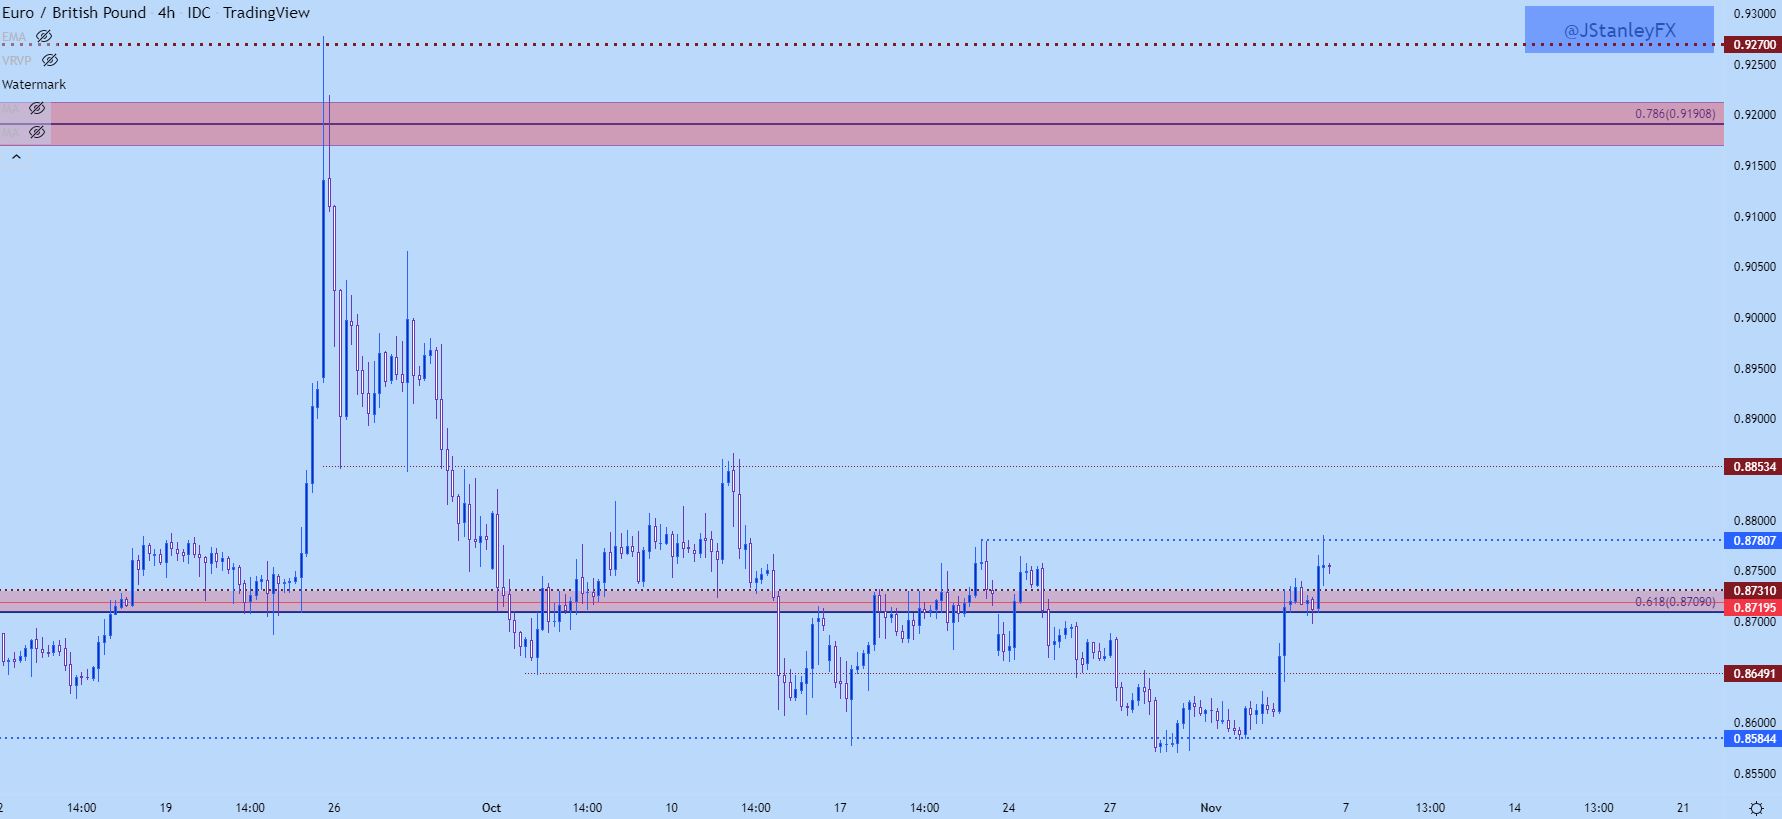
Chart prepared by James Stanley; EURGBP on Tradingview
EUR/GBP Longer-Term
Since I’m talking about a possible directional play in EUR/GBP, I’d be remiss if I didn’t point out how this fits in the longer-term backdrop.
Taking a step back on the chart and the range over the past year is a little more than 1,000 pips. But, perhaps more telling than the mean or the median is the mode, or the frequency of price tests that have traded around current levels; and those flickers up to longer-term resistance have been fast and brief. Most recently, that was the collapse-like move in the GBP that saw EUR/GBP jump up for a re-test of .9270.
So, for bullish approaches, especially breakouts in a pair that often has a tendency to range, bulls will want to be fast as the move may not last for long. And, on the other side of that, for those that are looking to buy GBP, perhaps a move up to resistance at .8853 could be that open door to look for a fade, pressing against a Euro that doesn’t have a significant amount of fundamental strength behind it at the moment.
And for longer-term approaches, a re-test of the .9000 psychological level, coupled with a resistance reaction on the daily, can open the door for possible fades.

EUR/GBP Daily Chart
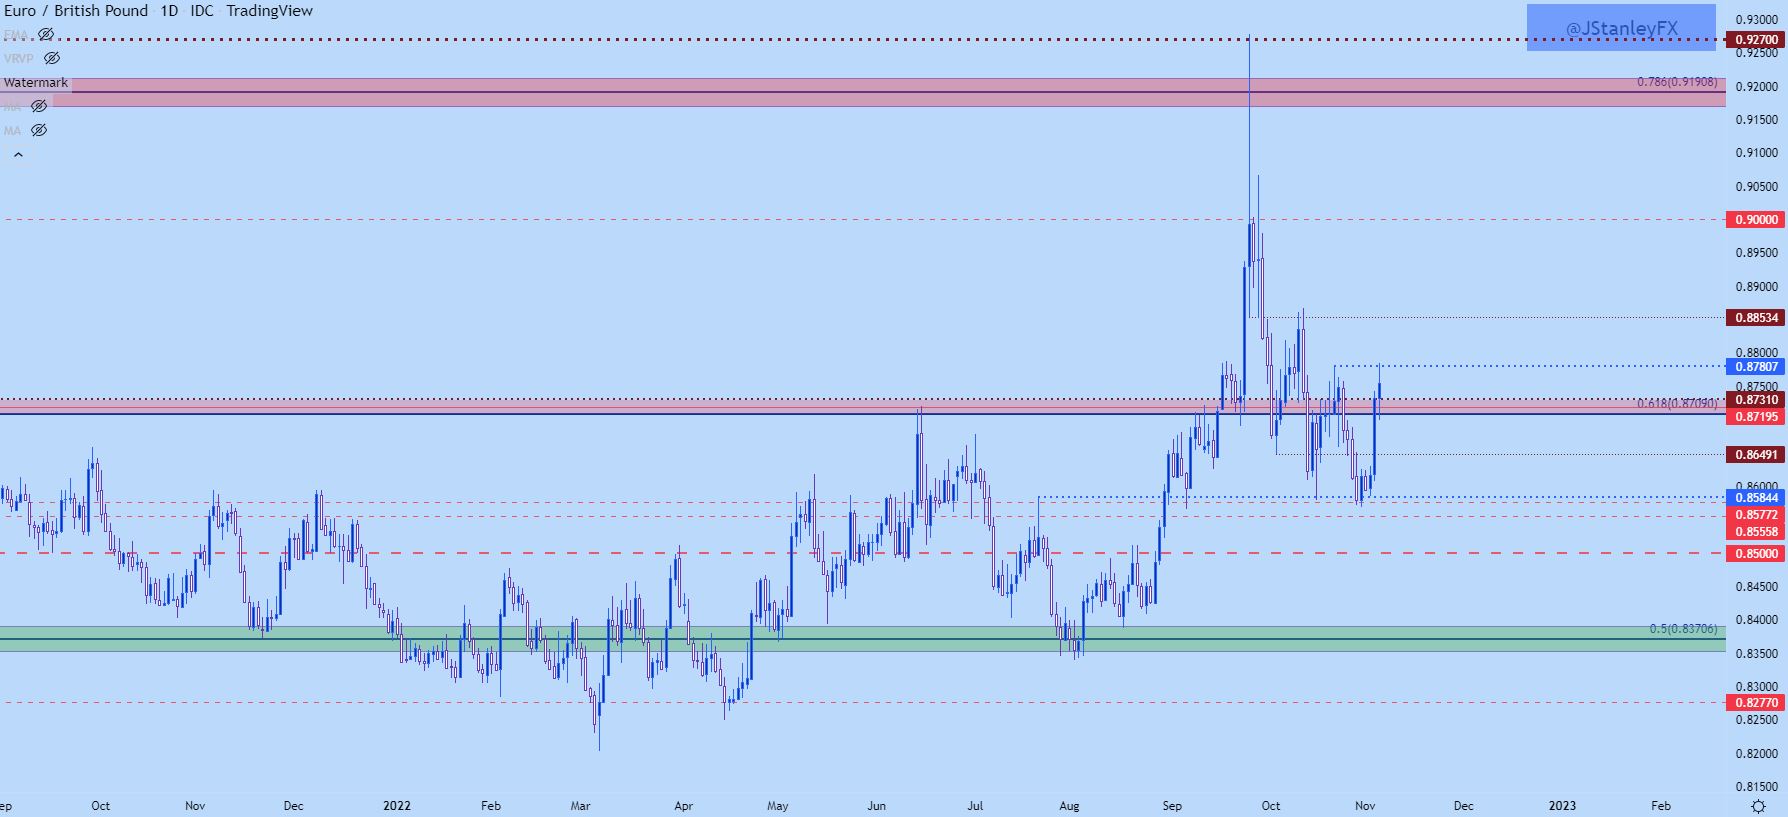
Chart prepared by James Stanley; EURGBP on Tradingview
--- Written by James Stanley, Senior Strategist, DailyFX.com & Head of DailyFX Education
Contact and follow James on Twitter: @JStanleyFX


