U.S. DOLLAR TECHNICAL FORECAST: BULLISH
- NFP undershoot complicates labor outlook and hawkish Fed.
- Technical patterns point to long-term upside.
DXY FUNDAMENTAL BACKDROP
This week Non-Farm Payrolls (NFP) yet again underwhelmed after a stellar ADP print, coming in at 199K for December. Although the unemployment rate seemingly positive, the participation rate is slightly weaker. In summary, not a very conclusive report which brings into question the Fed’s aggressive tightening outlook – as it assumes a strong labor market which may not necessarily be the case.
USD ECONOMIC CALENDAR

Source: DailyFX economic calendar


TECHNICAL ANALYSIS
U.S. DOLLAR INDEX WEEKLY CHART

Chart prepared by Warren Venketas, IG
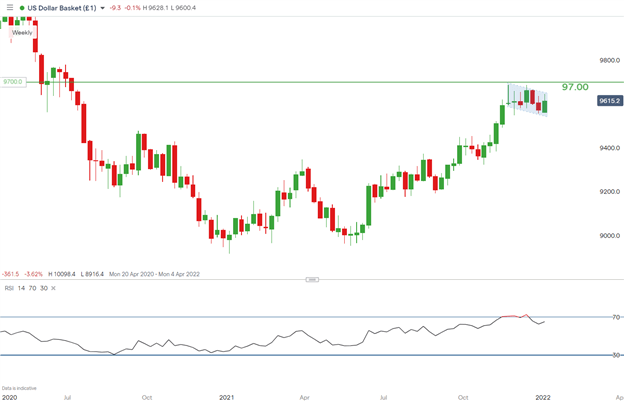
The weekly DXY chart above outlines the rollercoaster ride from March 2020 to present. The dollar has roughly clawed back 50% off the losses experienced during that period and now sits at levels last seen in July 2020. The shape of the recovery since then resembles that of a cup and handle formation with price action currently within the handle (blue) development.
Considering the Relative Strength Index (RSI) is coming off overbought territory, there is room for further downside before a push higher (breakout above handle resistance). Long-term I still favor dollar upside despite markets largely pricing in this bullish outlook.
U.S. DOLLAR INDEX DAILY CHART

Chart prepared by Warren Venketas, IG
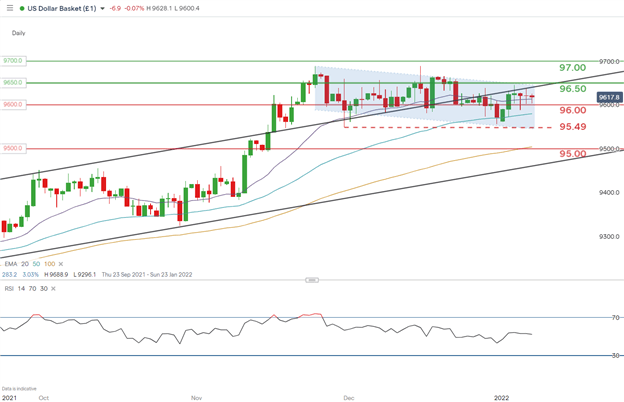
With attention on the daily chart, this week has been a week of doji candlesticks hinting to market uncertainty around direction and momentum. With markets looking to NFPs for clarity, it may have likely added further confusion to the current equation. That being said, the short-term technical setup remains skewed to the upside but a break (candle close) below 96.00 could open up room for bears to target the November swing low at 95.49.
From a bullish perspective, a push above 96.50 alongside bull flag resistance, should bring into consideration the 97.00 psychological handle.
Resistance levels:
- 97.00
- 96.50/bull flag resistance
Support levels:
- 96.00
- 95.49
Trade Smarter - Sign up for the DailyFX Newsletter
Receive timely and compelling market commentary from the DailyFX team
Contact and follow Warren on Twitter: @WVenketas


