


British Pound Technical Forecast: Bearish
- The British Pound has been one of the world’s weakest currencies after the BoE didn’t hike rates in early-November.
- Both GBP/USD and GBP/JPY have run into significant support areas on longer-term charts. Those zones are holding for now, but next week brings a busy economic calendar into the mix and if Sterling remains weak, those supports are vulnerable.
- The analysis contained in article relies on price action and chart formations. To learn more about price action or chart patterns, check out our DailyFX Education section.

The British Pound has been abysmally weak of recent as one of the weakest major currencies in the FX market. Despite projections for near-term rate hikes out of the BoE, the currency hasn’t been able to catch a break since the early-November rate decision. At that meeting, GBP/USD was bristling for a top-side breakout and there were very legitimate expectations for a rate hike at that meeting. But, when the BoE didn’t adjust and instead kicked the can, the currency started to fall and has pretty much continued to do so ever since.
As looked at on Thursday , GBP/USD and GBP/JPY both pushed down to significant spots of support. So far those areas have held, but the fact that buyers haven’t shown more of a concerted response is, at this point, bearish for forward-looking projections.
Next week brings a number of critical items on the economic calendar for both the U.K. and the U.S., and this can certainly provide that motivation on either side of the matter.
GBP/USD
As outlined in that Thursday piece, the support structure in GBP/USD is significant. This is the 2021 low which comes in at a 38.2% Fibonacci retracement of the 2020-2021 bullish move. It’s also at the very bottom of a bull flag formation. If prices broke through that floor, the flag would be invalidated and the next projected support would come in around the 1.3000 psychological level, after which 1.2833 comes into view.
GBP/USD Weekly Price Chart

Chart prepared by James Stanley; GBPUSD on Tradingview
Also as looked at ahead of the Friday CPI release, GBP/USD hadn’t shown many signs of life while dawdling around that long-term support, even as other pairs such as EUR/USD or AUD/USD had forced retracements. This highlighted the harboring bearish sentiment in GBP/USD, which could’ve made for a breakdown scenario should USD-strength pick up around that inflation release.
That did not happen, and this has allowed for GBP/USD to pullback a bit after a falling wedge formation had formed on shorter-term charts. This can keep the door open for a greater push up to an area of lower-high resistance in the longer-term theme. This puts focus on resistance potential around 1.3354, 1.3412 and then the 1.3500 level.
On the underside of this major support zone, the 1.3000 psychological level looms large, after which the 50% marker of that 2020-2021 major move plots around 1.2833.
GBP/USD Daily Price Chart
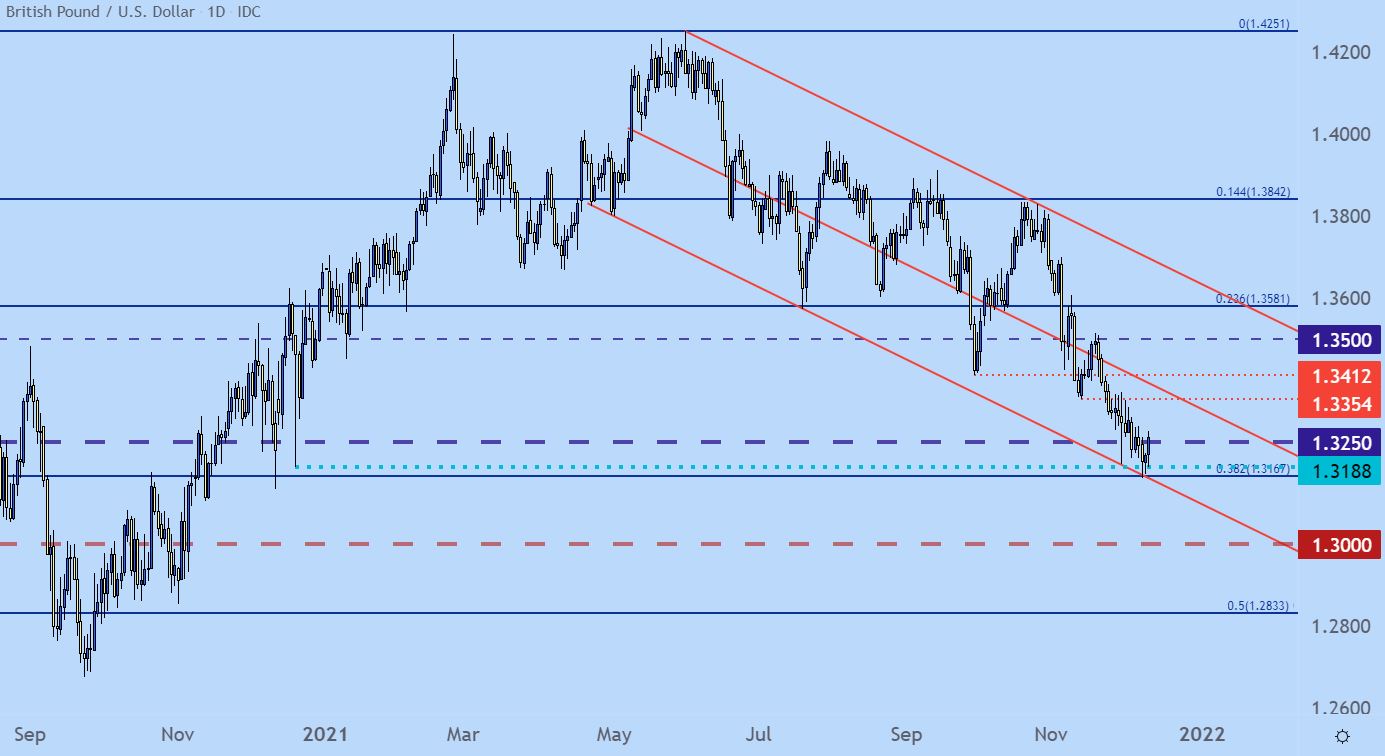
Chart prepared by James Stanley; GBPUSD on Tradingview
GBP/JPY
A similar scenario is showing around GBP/JPY at the moment, with prices in the pair pegged very close to what’s been the floor in the pair for the past nine months.
I’m setting the zone from the march and July low of 148.53 up to the April, September and, as of this writing, the December swing low. This zone has held a number of inflections so far and this seems to be a decent barometer of the risk on/off profile of markets so far this year, particularly in Q4.
When the Fed opened the door to a more-hawkish stance at the September rate decision, the Japanese Yen fell aggressively as rate hike bets drove carry trade setups in the market. But, after topping out on October 21st the trend has been decisively negative, allowing for price action to pose a brisk retreat back to this support.
So, while this zone remains as a price floor for now, the velocity with which sellers have driven GBP/JPY keeps the door open to breakdown scenarios. The key for that to fill-in will be Yen-strength, which could show for a couple of possible reasons, such as problems around China or US rates heading lower, further diminishing the attractiveness of carry trade strategies. But, at this point, that zone is support until it’s not. A breach below the bottom of the zone opens the door for breakdown moves into the 145.69 level, followed by support potential around the 142.50 area.
On the topside of near-term price action, resistance potential remains around prior swings at 151.13 followed by the 152.00 handle. The psychological level at 152.50 remains key, as bullish breaks above that price will signal negation of the bearish theme.
GBP/JPY Daily Price Chart
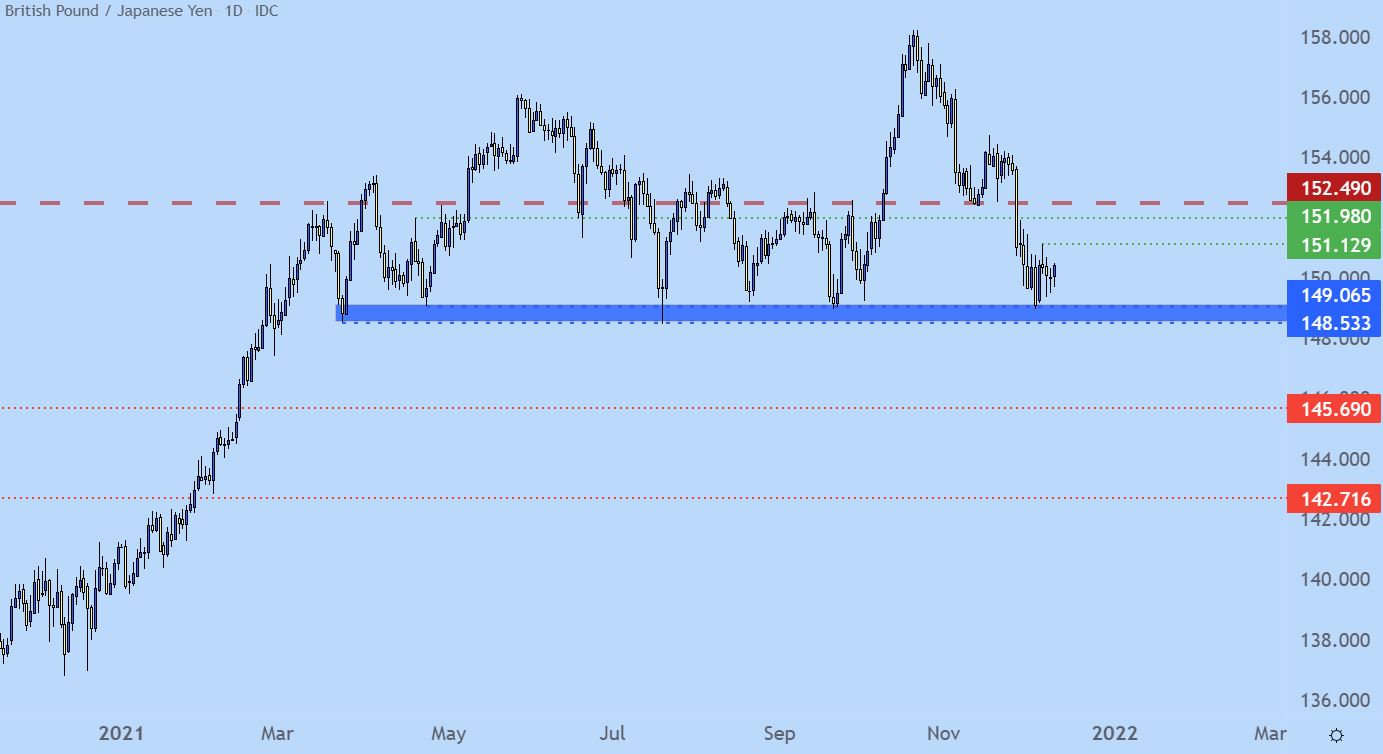
Chart prepared by James Stanley; GBPJPY on Tradingview
--- Written by James Stanley, Senior Strategist for DailyFX.com
Contact and follow James on Twitter: @JStanleyFX


