


S&P 500 WEEKLY OUTLOOK: SLIGHTLY BEARISH
- The recent rally in the S&P 500 has been driven by the stocks with the largest weighting in the index
- Deteriorating breadth and limited upside participation point to low confidence in the broader market
- Failed attempts by the S&P 500 to break above the 4,700 level may be a sign that buying momentum is waning and a pullback may be just around the corner
Trade Smarter - Sign up for the DailyFX Newsletter
Receive timely and compelling market commentary from the DailyFX team
Most read: How to Research Stocks: A Step-by-Step Guide
The S&P 500 has been on an impressive bullish run recently, climbing roughly 10% from last month’s low to new all-time highs, supported by strong third-quarter corporate earnings, constructive profit guidance and positive sentiment. The gains, however, have not been widespreadamong the benchmark members as the secular mega-caps with the largest weight (Microsoft, Apple, Amazon, Alphabet and Tesla to name a few) have been the main drivers behind the explosive rally.
From a technical standpoint, weakening breadth and limited upside participation point to fragile investor confidence in the broader market and thus unhealthy fundamentals. If a stock index only relies on a few names to move higher, it is not firing on all cylinders, so there must be weakness behind the scenes. To analyze current dynamics, we can look at the relationship between the equal-weighted S&P 500 and the capitalization-weighted S&P 500, using the RSP ETF as tradable proxy for former and the SPY ETF for the latter.
The chart below has two panels. The top one shows SPY by itself, while the bottom one displays the RSP/SPY ratio. After examining price action from the past two months, we can see that SPY has been rising steadily since early October, while the RSP/SPY ratio has been declining, falling on Friday to its lowest level since February. This behavior suggests that buying interest is concentrated in the large and most influential stocks, with money flowing disproportionately into the heavy hitters rather than to the smaller and average companies that are part of the benchmark (if the smaller companies were driving the rally, the RSP/SPY would slope upwards).
SPY AND RSP/SPY RATIO CHART
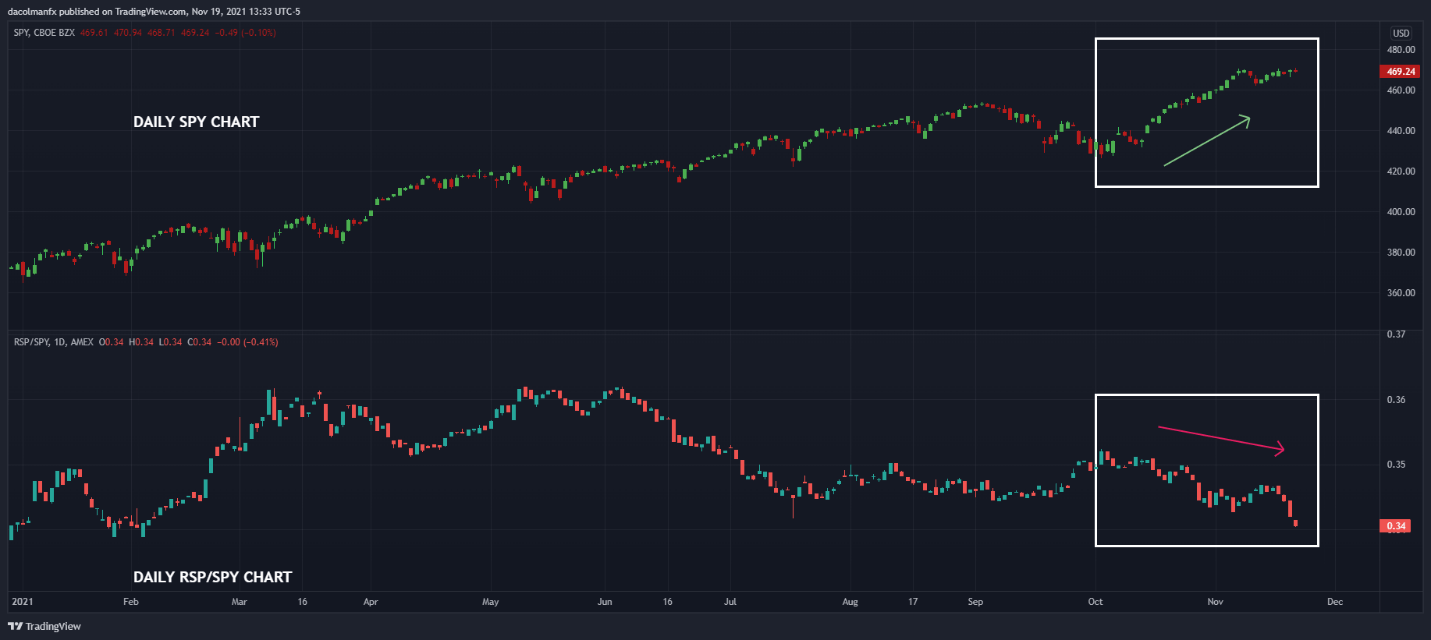
Source: TradingView
When upturn participation is not broad-based, anyrallystands on shaky footing, so markets can bemore vulnerable to a pullback should the winds shift and sentiment change. For this reason, traders should become less complacent and start exercising more caution, particularly during the U.S. Thanksgiving holiday week as thinner liquidity can amplify market moves unexpectedly.

S&P 500 TECHNICAL ANALYSIS
Focusing on the S&P 500 index, the technical bias remains positive in the medium term, but in the short term, the ongoing rally appears to be losing momentum as the RSI indicator flirts with overbought territory and price struggles to break above the psychological 4,700 level decisively.
In terms of price action, failure to clear the 4,700 area after numerous attempts in the last few days suggests that buying interest is fading, awarning that a downturn may be in sight. If a pullback does materialize, the index could head towards the 4,630-support zone before staging a rebound, although a move below that floor could accelerate the decline and expose the 4,580 area.
On the other hand, if the S&P 500 defies expectations and manages to overtake the 4,700-barrier in a resolute fashionin the week ahead, bullish sentiment could strengthen, allowing the index to charge higher towards channel resistance near 4,760.
| Change in | Longs | Shorts | OI |
| Daily | 1% | -1% | 0% |
| Weekly | 15% | -13% | -1% |
S&P 500 TECHNICAL CHART
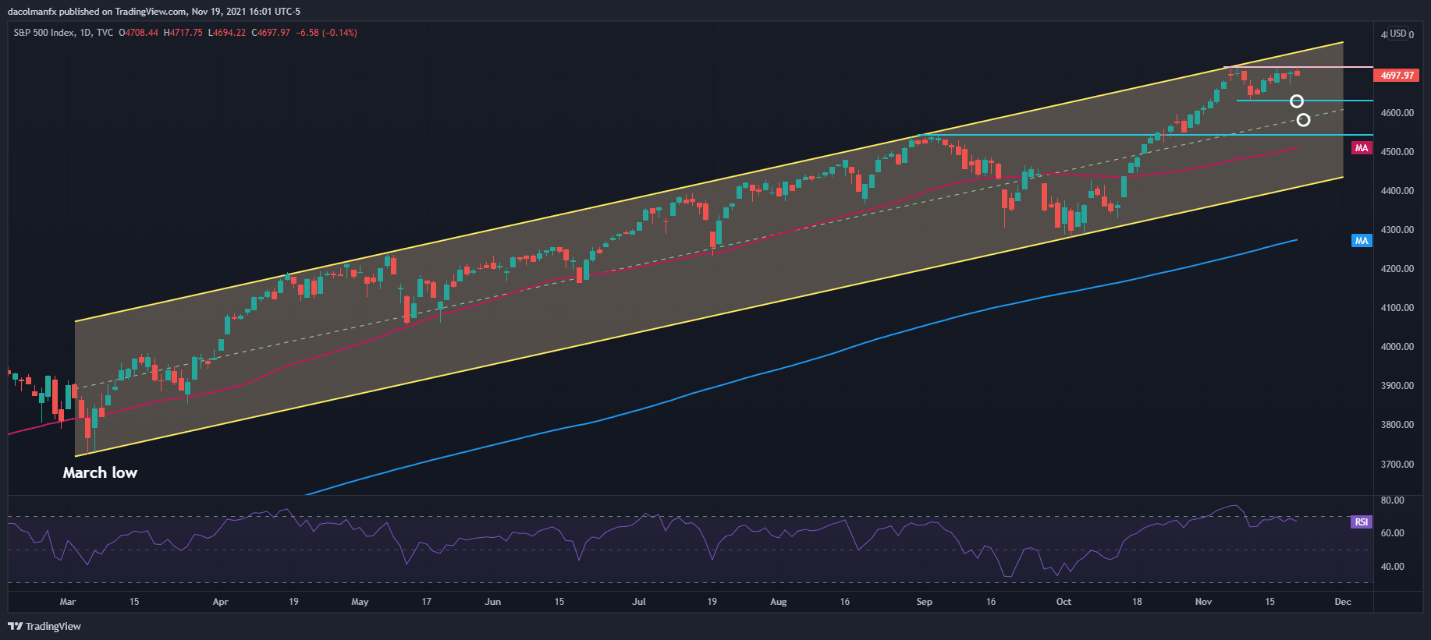
S&P 500 (SPX) Chart by TradingView
EDUCATION TOOLS FOR TRADERS
- Are you just getting started? Download the beginners’ guide for FX traders
- Would you like to know more about your trading personality? Take the DailyFX quiz and find out
- IG's client positioning data provides valuable information on market sentiment. Get your free guide on how to use this powerful trading indicator here.
---Written by Diego Colman, Contributor


