


S&P 500 OUTLOOK:
- S&P 500 rises and comes within a whisker of setting a fresh record close
- Strong economic data bolsters bullish sentiment, increasing appetite for stocks
- The technical backdrop for the S&P 500 continues to be positive
Trade Smarter - Sign up for the DailyFX Newsletter
Receive timely and compelling market commentary from the DailyFX team
Most read: What Does the Inflation Surge Mean for Gold, Stocks, & the US Dollar?
After a flat start of the week, U.S. stocks climbed toward record on Tuesday supported by risk-on moodsparked by robust macro data. Earlier in the day, the Census Bureau said October retail sales rose 1.7%, three-tenths of a percent above consensus and the highest reading since March, with broad-based strength in several categories, from motor vehicles to electronics to building materials.
Solid retail sales results suggest excess savings and rising wages have helped Americans sustain healthy consumption despite mounting inflationary pressures and falling confidence levels, which was reflected in the latest University of Michigan Sentiment Survey. As a rule of thumb, a strong consumer bodes well for economic activity as household expenditures accounts for roughly 70% of GDP.
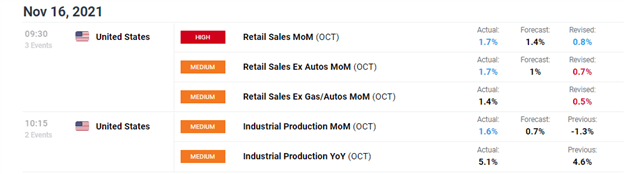
Source: DailyFX Economic Calendar
However, the good news did not end there. October industrial production also beat forecasts, at 1.6% versus the 0.7% expected, as durable and non-durable goods manufacturing picked up the pace after disruptions caused by Hurricane Ida.
Against this backdrop, the S&P 500 climbed 0.39% to 4,700, while the Nasdaq 100 increased 0.75% to end the day at 16,309. Meanwhile, the Dow rose 0.15% to 36,142, bolstered by a 5.79% surge in Home Depot shares after the home improvement company beat earnings projections by a wide margin.

With earnings growing at a healthy clip, record margins for corporate America, constructive profit guidance and a positive outlook for near-term economic activity, there is room for the major averages to grind higher heading into the holiday season, but it may be time to be more selective as reopening stocks may have more upside amid improving prospects for the services sector.
Granted, the transitionto tighter monetary policy could be headwind for the equity market, but it may not be an imminent threat yet as the Fed continues to embrace a dovish stance and signals that it will be patient before raising rates. That said, it would not be surprising if bullish sentiment prevailed and stocks charged towards new highs in the latter part of the year, helped by strong institutional and retail buying activity.
| Change in | Longs | Shorts | OI |
| Daily | 1% | -1% | 0% |
| Weekly | 15% | -13% | -1% |
S&P 500 TECHNICAL ANALYSIS
Following the latest leg higher, the S&P 500 has come within a whisker of its all-time high near 4,718.50, a key technical ceiling. If buyers manage to push the benchmark above this barrier decisively in coming sessions, price could head towards channel resistance at 4,755, before charging towards the 4,800 psychological level.
On the flip side, if upside momentum wanes and the index pivots lower, support appears near the November 10 swing low at 4,655, but a pullback towards 4,580 could materialize if that floor were to be breached in the short-term.
S&P 500 FOUR-HOUR TECHNICAL CHART
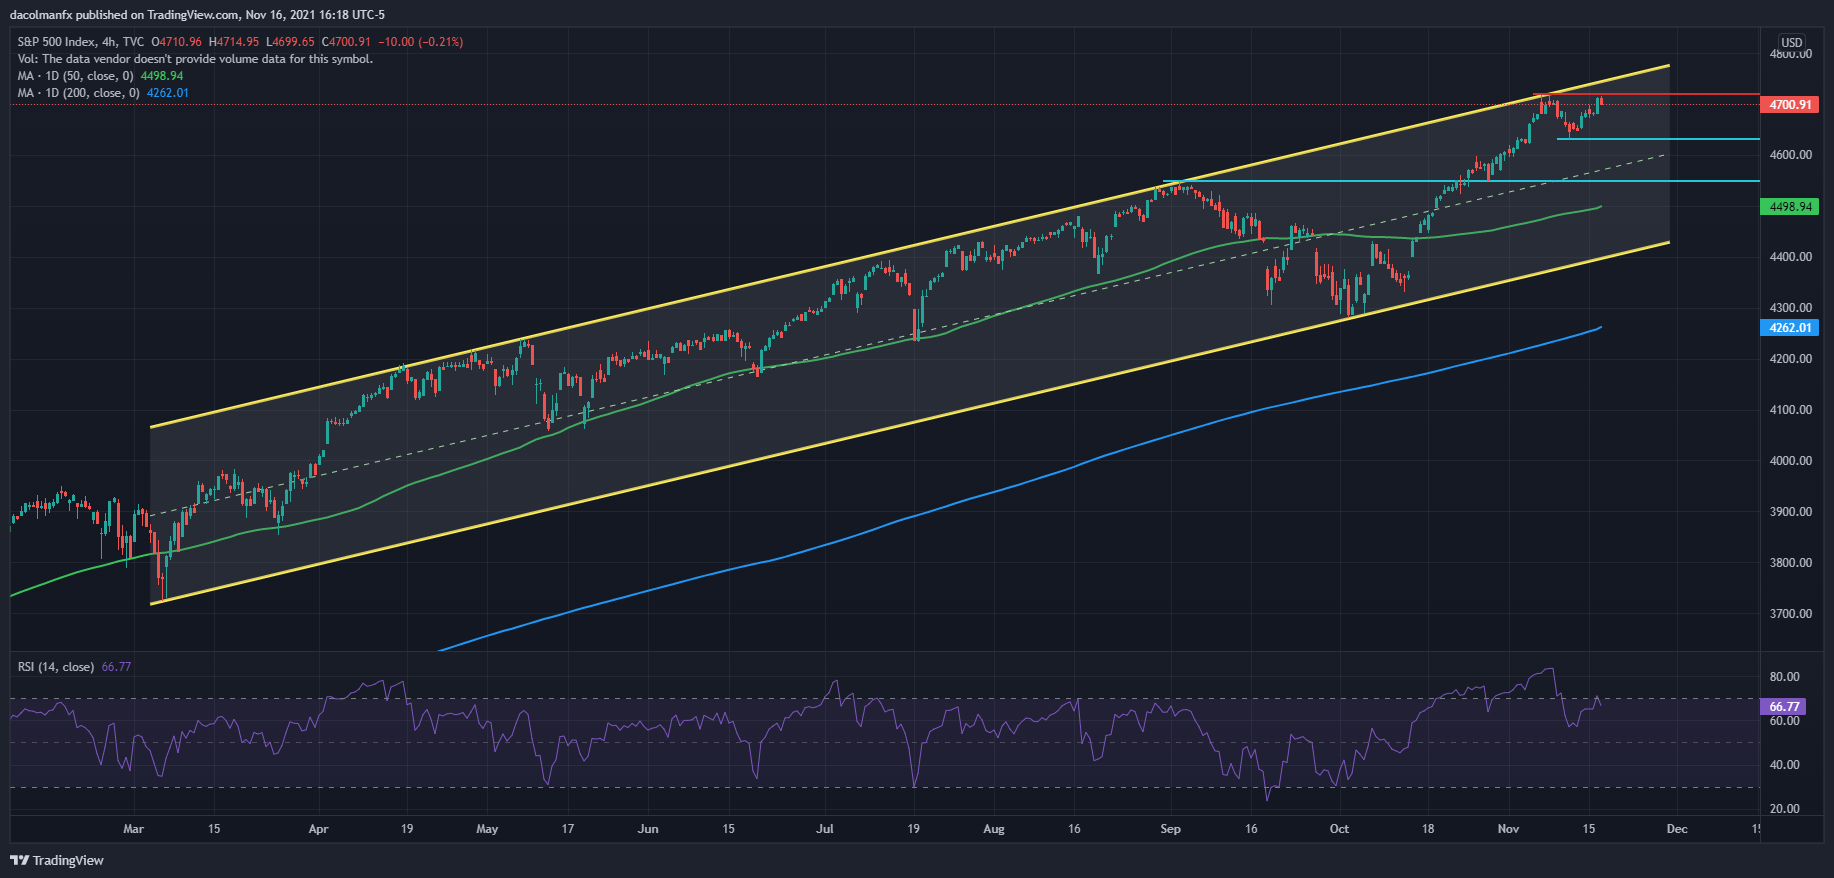
S&P 500 (SPX) Chart by TradingView
EDUCATION TOOLS FOR TRADERS
- Are you just getting started? Download the beginners’ guide for FX traders
- Would you like to know more about your trading personality? Take the DailyFX quiz and find out
- IG's client positioning data provides valuable information on market sentiment. Get your free guide on how to use this powerful trading indicator here.
---Written by Diego Colman, Contributor


