


MKT CALL: MACRO OVERVIEW:
- Skyrocketing Fed hike odds and a widening of the belly of the US yield curve have lifted the US Dollar to fresh yearly highs.
- Oil prices may be in a sideways lurch, and a double top is possible if the November low is broken.
- US stocks are treading water, not unexpected given seasonal trends for mid-November. But the end of the year is expected to be strong; buy the dip mentality remains.
That US Dollar is So Hot Right Now
In this week’s edition of MKT Call: Macro (formerly The Macro Setup), we talked about how hot US inflation figures are pushing markets to do the Fed’s bidding – pricing in more rate hikes even as Fed officials suggest that patience is warranted – which is helping the US Dollar (via the DXY Index) extend its rally to fresh yearly highs.
Part of the strong US Dollar story is the weak Euro story. Plagued by rising COVID-19 infections, bad news on the energy supply front as Germany has announced its delaying certification of the Nord Stream 2 pipeline from Russia, and a European Central Bank that seems determined to keep interest rates low regardless of incoming inflation data, the Euro has been falling sharply in recent days. The widening chasm between Fed and ECB policy is playing a significant part in helping prop up the DXY Index.
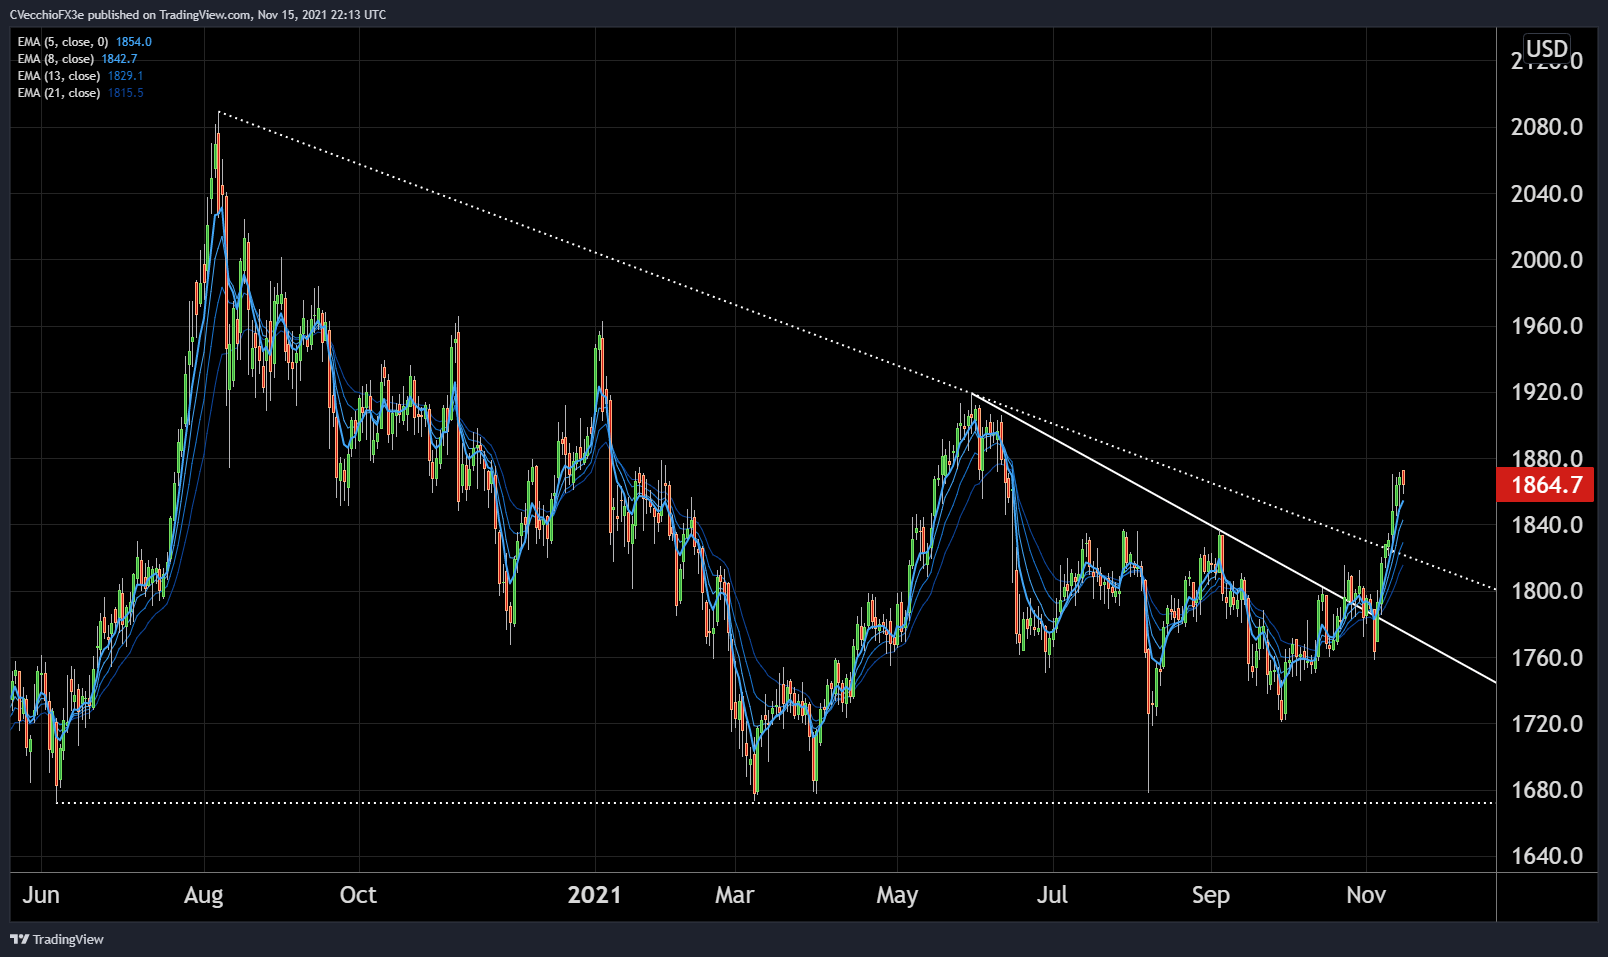
Even as the US Dollar rally continues, precious metals have been revived in their role as an historical inflation hedge (move over, Bitcoin and Etherium). Gold prices have made an important technical breakout above the 1835 level, and with US inflation readings expected to stay elevated into 1Q’22, the environment of lower real yields that has help spur the rally in gold prices may persist for a few more months – setting up a potential return above 1900 and more in the near-term.
*For commentary from Dan Nathan, Guy Adami, and myself on the US Dollar (via the DXY Index), the US S&P 500, gold prices, Bitcoin, among others, please watch the video embedded at the top of this article.
CHARTS OF THE WEEK
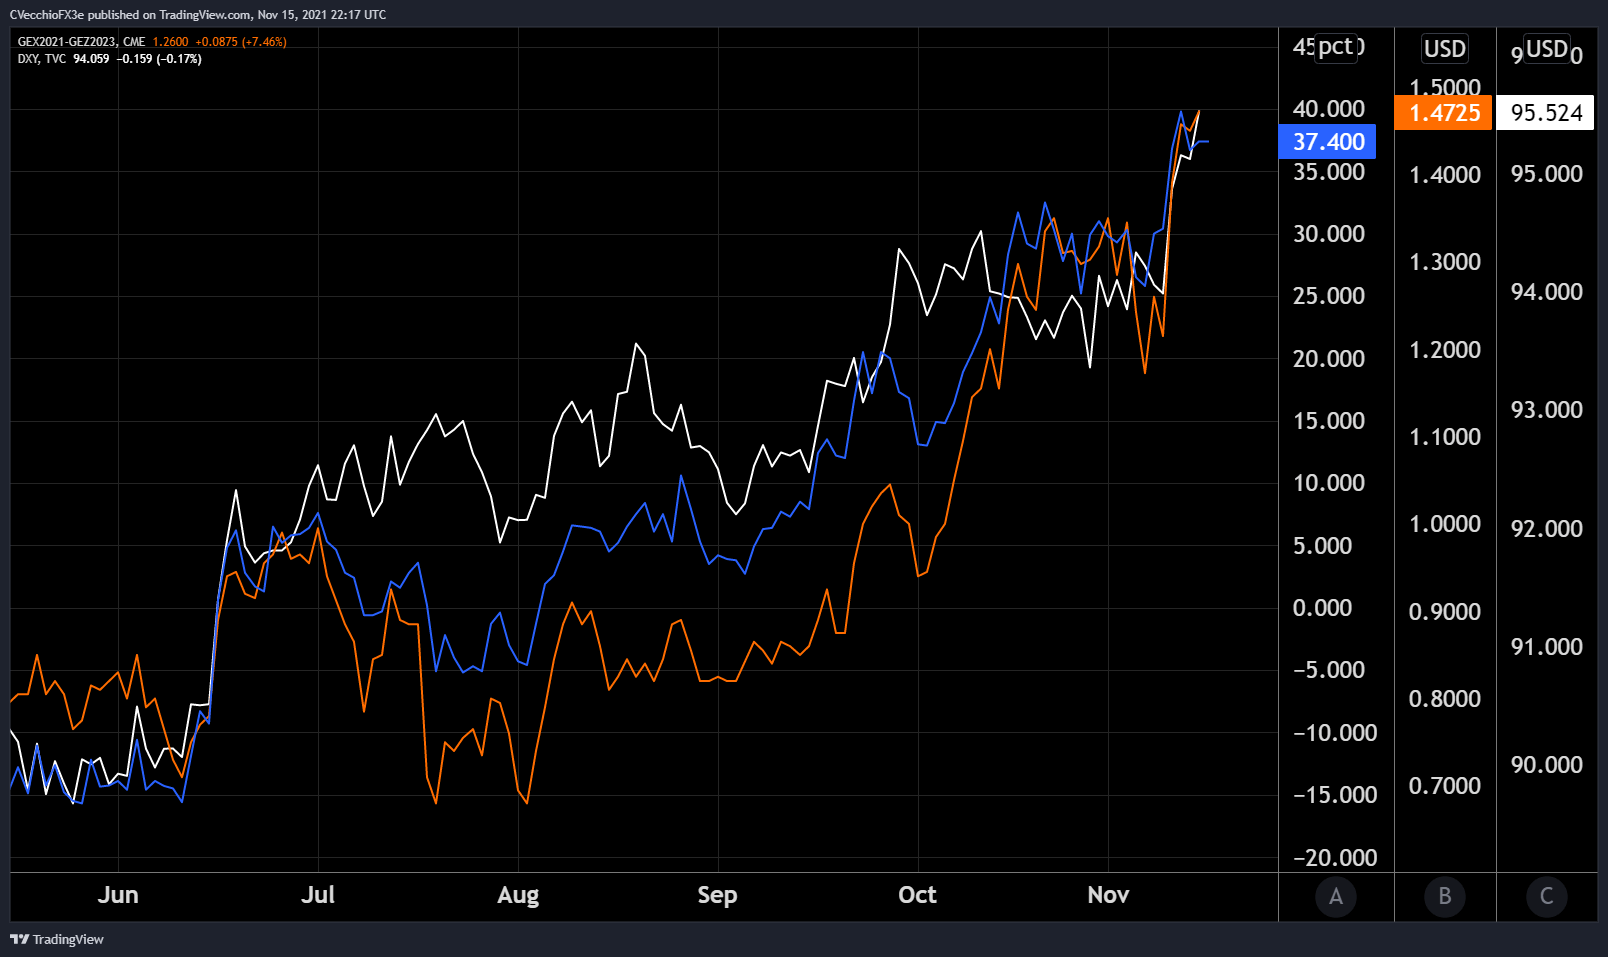
Eurodollar Futures Contract Spread (DECEMBER 2021-DECEMBER 2023) [BLUE], US 2s5s10s Butterfly [ORANGE], DXY Index [WHITE]: Daily Chart (MAY 2021 to NOVEMBER 2021) (Chart 1)
GOLD PRICE TECHNICAL ANALYSIS: DAILY CHART (MAY2020 TO NOVEMBER 2021) (CHART 2)
GBP/JPY RATE TECHNICAL ANALYSIS: DAILY CHART (MARCH 2020 TO NOVEMBER 2021) (CHART 3)


--- Written by Christopher Vecchio, CFA, Senior Strategist


