GBP/USD WEEKLY FORECAST: BEARISH
- GBP/USD has been rejected at resistance several times over the past few days
- Fading bullish impetus points to near-term weakness in Pound Sterling
- Volatility is likely to increase in the week ahead amid key monetary policy announcements
Most read: Shiba Inu (SHIB), Spot Gold (XAU/USD) & NASDAQ 100 Index (NDX) – FinTwit Trends to Watch
Trade Smarter - Sign up for the DailyFX Newsletter
Receive timely and compelling market commentary from the DailyFX team
From its yearly lows near 1.3411 established in late September, GBP/USD has bounced significantly over the course of this month, climbing more than 2% amid strengthening bullish sentiment towards the British currency in a context of repricing of rate expectations. Despite this large upside move, buying momentum appears to be waning as reflected by recent price action.
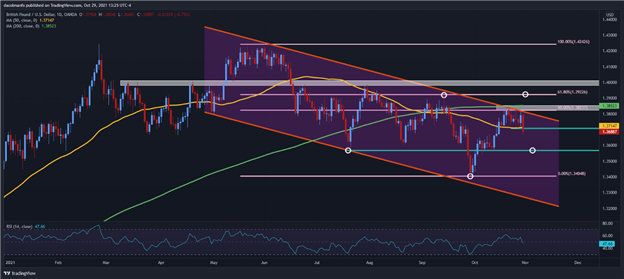
The daily chart shows that GBP/USD has been trading mostly sideways since last week, after failing multiple times to clear cluster resistance in the 1.3830/1.3855 region. This area has strong technical significance, as it is where the 200-day SMA converges with the upper boundary of a medium-term descending channel and the 50% Fib retracement of the June/September correction.
| Change in | Longs | Shorts | OI |
| Daily | 3% | -7% | -3% |
| Weekly | 4% | -10% | -5% |
With upside pressure clearly weakening amid a solid ceiling in place, the near-term bias points to Pound Sterling weakness in the week ahead, when volatility is likely to be higher than usual due to two major risk events: the Federal Reserve and Bank of England’s monetary policy announcement.
If the bearish scenario plays out following Friday’s decline, traders should keep a close eye on whether GBP/USD holds below its 50-day moving average and the psychological mark of 1.3700, as a sustained move below this area may be the harbinger of a large sell-off, capable of taking price towards 1.3570, followed by 1.3410 in early November.
In case of an unexpected bounce, which at this point seems less likely, the first resistance to consider appears at 1.3830/1.3855. A decisive push above this barrier and channel breakout are needed to rejuvenate the bullish impetus seen earlier this month and pave the way for buyers to reclaim the September high near 1.3913.


GBP/USD TECHNICAL CHART

Source: TradingView
EDUCATION TOOLS FOR TRADERS
- Are you just getting started? Download the beginners’ guide for FX traders
- Would you like to know more about your trading personality? Take the DailyFX quiz and find out
- IG's client positioning data provides valuable information on market sentiment. Get your free guide on how to use this powerful trading indicator here.
---Written by Diego Colman, Contributor


