


FINTWIT ANALYSIS
- Meme coin Shiba Inu bests Dogecoin.
- Gold slumps back into medium-term symmetrical triangle pattern.
- Supply chain challenges hit tech stocks, NASDAQ 100 slips.
Shiba Inu now world’s 9th largest cryptocurrency!
Shiba Inu (SHIB) has exceeded expectations this week after a meteoric rise in price action saw the Dogecoin derivative enter the top 10 cryptocurrency list in terms of market capitalization – see graphic below:
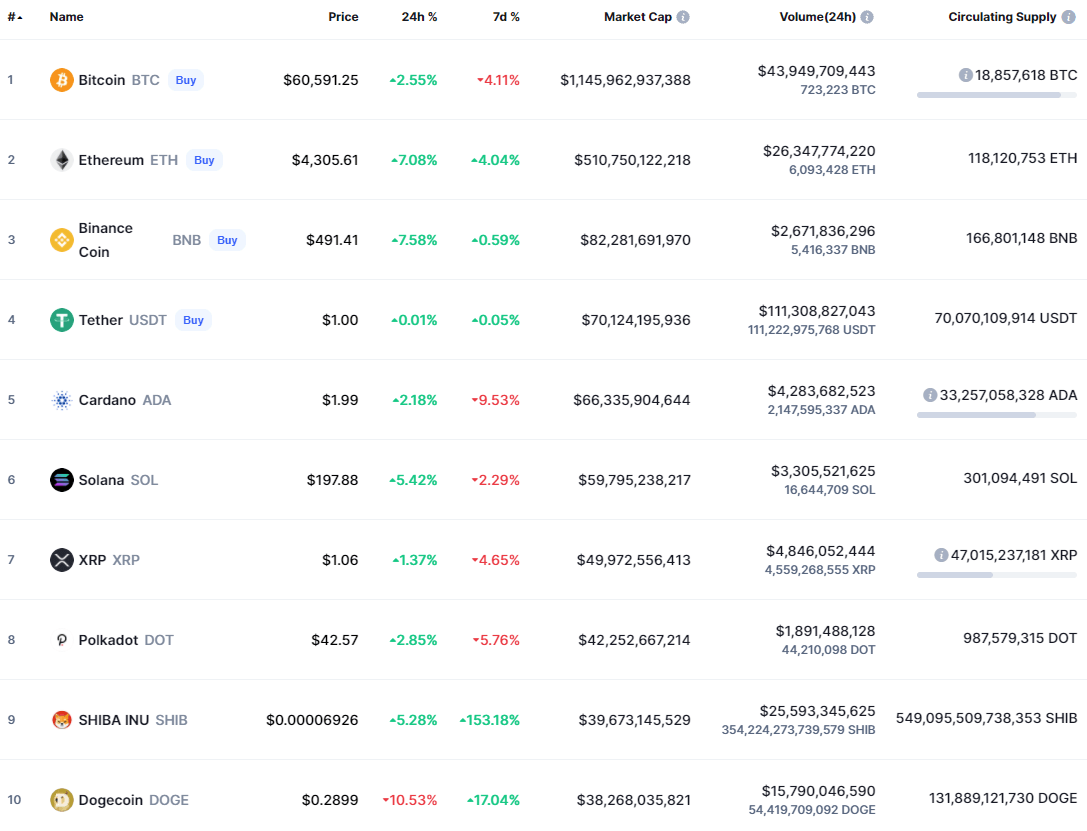
Source: coinmarketcap.com
The impetus behind the SHIB rally sources from the potential for the coin to feature on the Robinhood platform. Twitter and fintwit was abuzz this week with #SHIB tweets directed at Robinhood from thousands of supporters of the initiative. Robinhood has mentioned in a statement this week that they are in no rush to add the coin due to regulatory concerns but the opportunity cost of not listing may result in the companies bottom line.
SHIB DAILY CHART
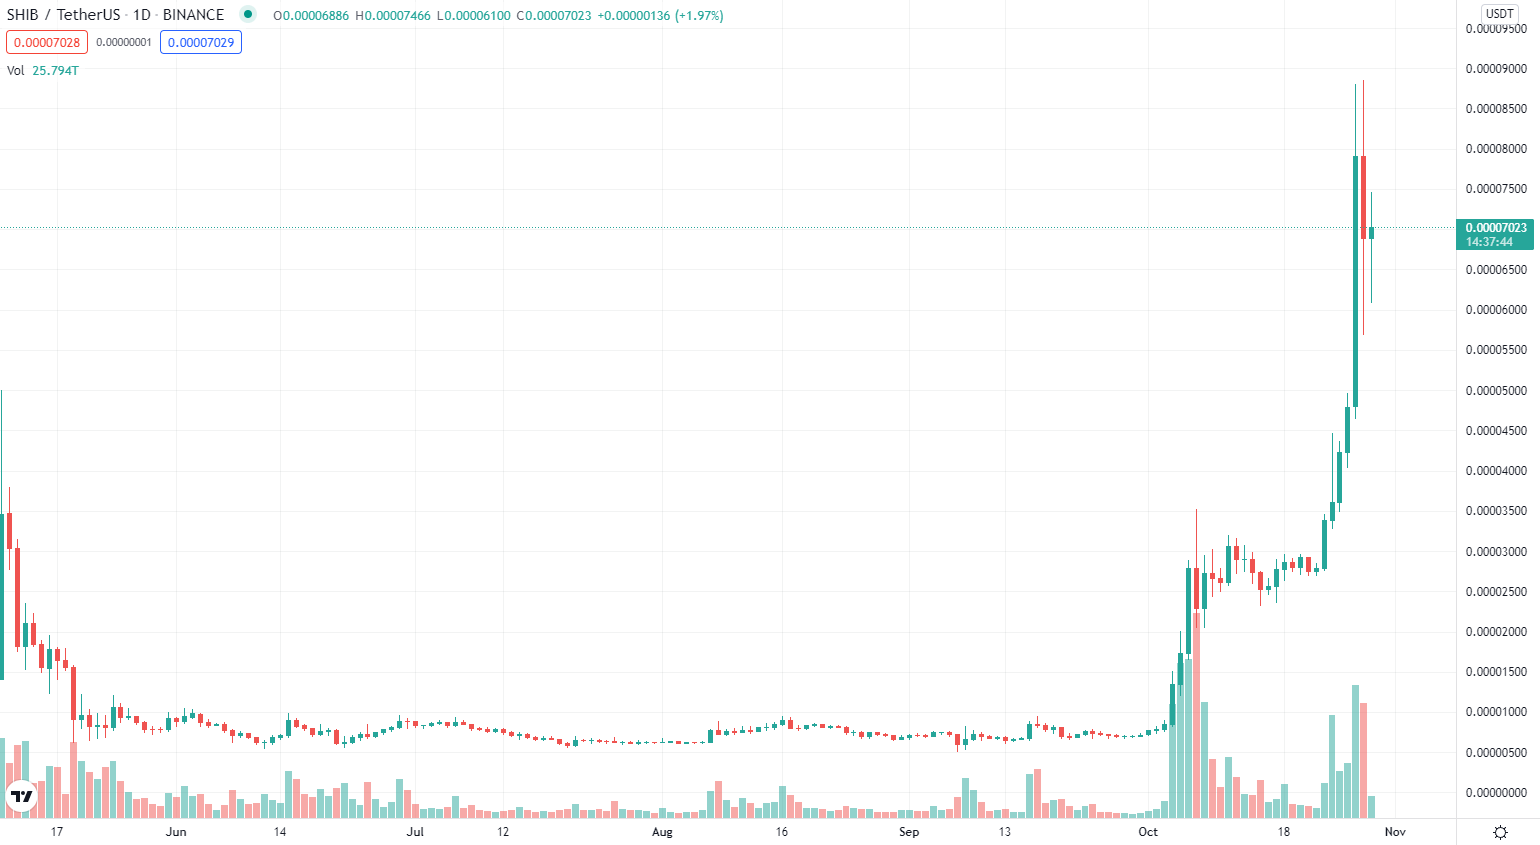
Source: TradingView
The daily SHIB chart above illustrates the recent upside move this week. After reaching all-time-highs (ATH) yesterday, there seems to be some profit taking after the cautious statement released by Robinhood.
Grow your crypto knowledge and understanding by familiarizing yourself with the proper terminology!
HAS GOLD LOST ITS INFLATION HEDGE ALLURE?

The prospects of interest rate hikes seem to be restricting gold upside as next week’s Federal Reserve rate decision looms. Yesterday’s U.S. GDP shortfall along with persistent high inflation are adding to the hawkish tilt that is reflective in the stronger dollar on Friday. A traditional safe-haven hedge, bullion has been underwhelming particularly in an environment where treasury yields are rising. QE tapering and rate hike expectations favor higher U.S. Treasury yields and a stronger dollar, putting a dampener on gold demand. For now it seems that markets are at loggerheads between inflationary pressure and central bank hawkishness resulting in an noncommittal gold price.
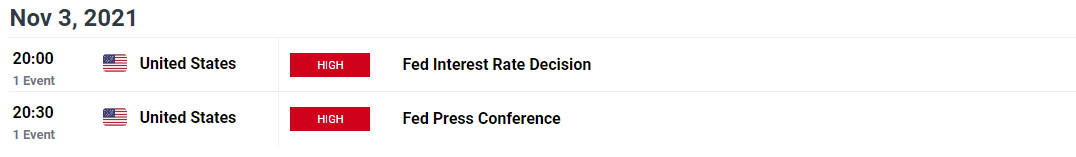
Source: DailyFX economic calendar
XAU/USD DAILY CHART

Chart prepared by Warren Venketas, IG
The technical’s currently reflect the fundamental uncertainty mentioned above with gold prices hovering around the $1800 per ounce key area of confluence. The recent breakout from the symmetrical triangle formation (black) has been stifled and swiftly placed back within triangle resistance. With QE tapering details soon to be announced and the potential for hints around tightening, we may see a turnaround in the greenback thus adding adverse pressure on gold prices.
Key resistance levels:
- $1836.94
- $1800.00
Key support levels:
- $1763.30
- $1750.00
NASDAQ 100 TAKES A BREATHER AS TECH GIANTS EARNINGS DISSAPOINT
Apple and Amazon, two of the most prominent stocks making up the Nasdaq-100 index (roughly 18%) fell short of estimates this week weighing down the NDX. New all-time-highs were reached on Thursday this week but post- earnings saw a drop off towards the 15600 handle. According Apple CEO Tim Cook, input woes are a key contributor hampering earnings projections via chip shortages which would have effected Amazon numbers as well. Amazon faced additional challenges including product shortages, rising labour costs and the increasing competition in the online shopping space.
The start of the Fed’s reduction in asset purchases in conjunction with rising treasury yields should have an adverse effect on techs as support slackens and valuations drop. These factors point to a downside correction for the index.
Boost your stock market knowledge with our articles on the types of stocks available, how equities impact the economy, and getting started with stock trading.
NDX DAILY CHART
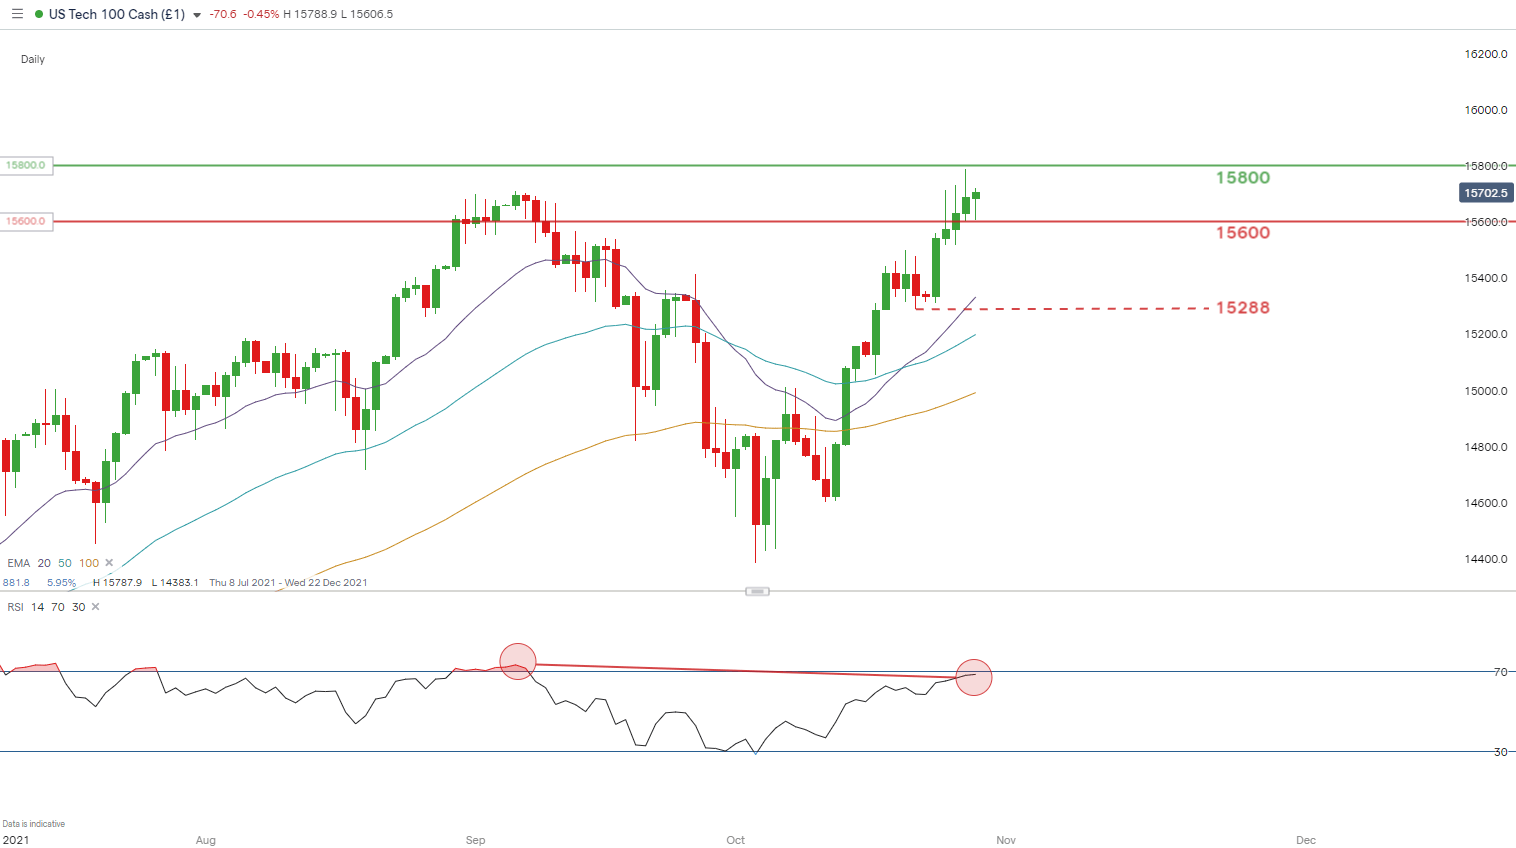
Chart prepared by Warren Venketas, IG
The daily Nasdaq-100 chart above illustrates the extraordinary bullish effect of the earnings season on the U.S. tech sector thus far. The Relative Strength Index (RSI) currently displays slowing upside momentum relative to NDX price action. The NDX price reflects higher highs whereas the RSI prints lower (red) in relation to these higher highs. This is known as bearish divergence and could unfold into a bearish reversal thus bringing support targets into consideration. The likelihood of a mean reversion is favored however caution should be exercised as the recent uptrend has been strong.
Key resistance levels:
- 15800
Key support levels:
- 15600
- 15288

--- Written by Warren Venketas for DailyFX.com
Contact and follow Warren on Twitter: @WVenketas


