


GBP/USD WEEKLY FORECAST: BEARISH
- GBP/USD has been coiling inside a symmetrical triangle over the past few months, a sign that the pair is in a consolidation stage
- With the Fed and Bank of England’s monetary policy decision next week, volatility could pick up and trigger an explosive move in price action
- A downside breakout appears likely, especially after the flareup of a death cross in the daily chart earlier this month
Trade Smarter - Sign up for the DailyFX Newsletter
Receive timely and compelling market commentary from the DailyFX team
Most read - GBP/USD Forecast: China Risks, Fed & BoE Decisions, Pound Reversal Coming?
GBP/USD’s price action has been unexciting over the past few months. During this time, the pair has been coiling inside what appears to be a symmetrical triangle, making lower highs and higher lows in a sequential fashion, a clear trait of an asset in consolidation mode.
Lately, lower volatility on account of thinner volume, typical of the summer season, has made price action even less attractive to traders accustomed to wild swings. In fact, neither red-hot inflation nor weak retail sales data from the UK this week were able to rouse the pair from its slumber.
At the same time, uncertainty over the path of monetary policy in the U.S. and U.K. ahead of the September Fed and Bank of England’s meeting may have led traders to stay on the sidelines and avoid taking large directional positions in GBP/USD. However, with the FOMC and BoE decision next week, the market's lethargy could soon end, paving the way for an explosive move.
From a strictly technical point of view, what any of these central banks decide to do is irrelevant; the only thing that matters is how prices react to their actions. The market's reaction, in turn, could provide clues as to the short-term outlook and general sentiment.

Related: An Overview of the GBP/USD Forex Pair
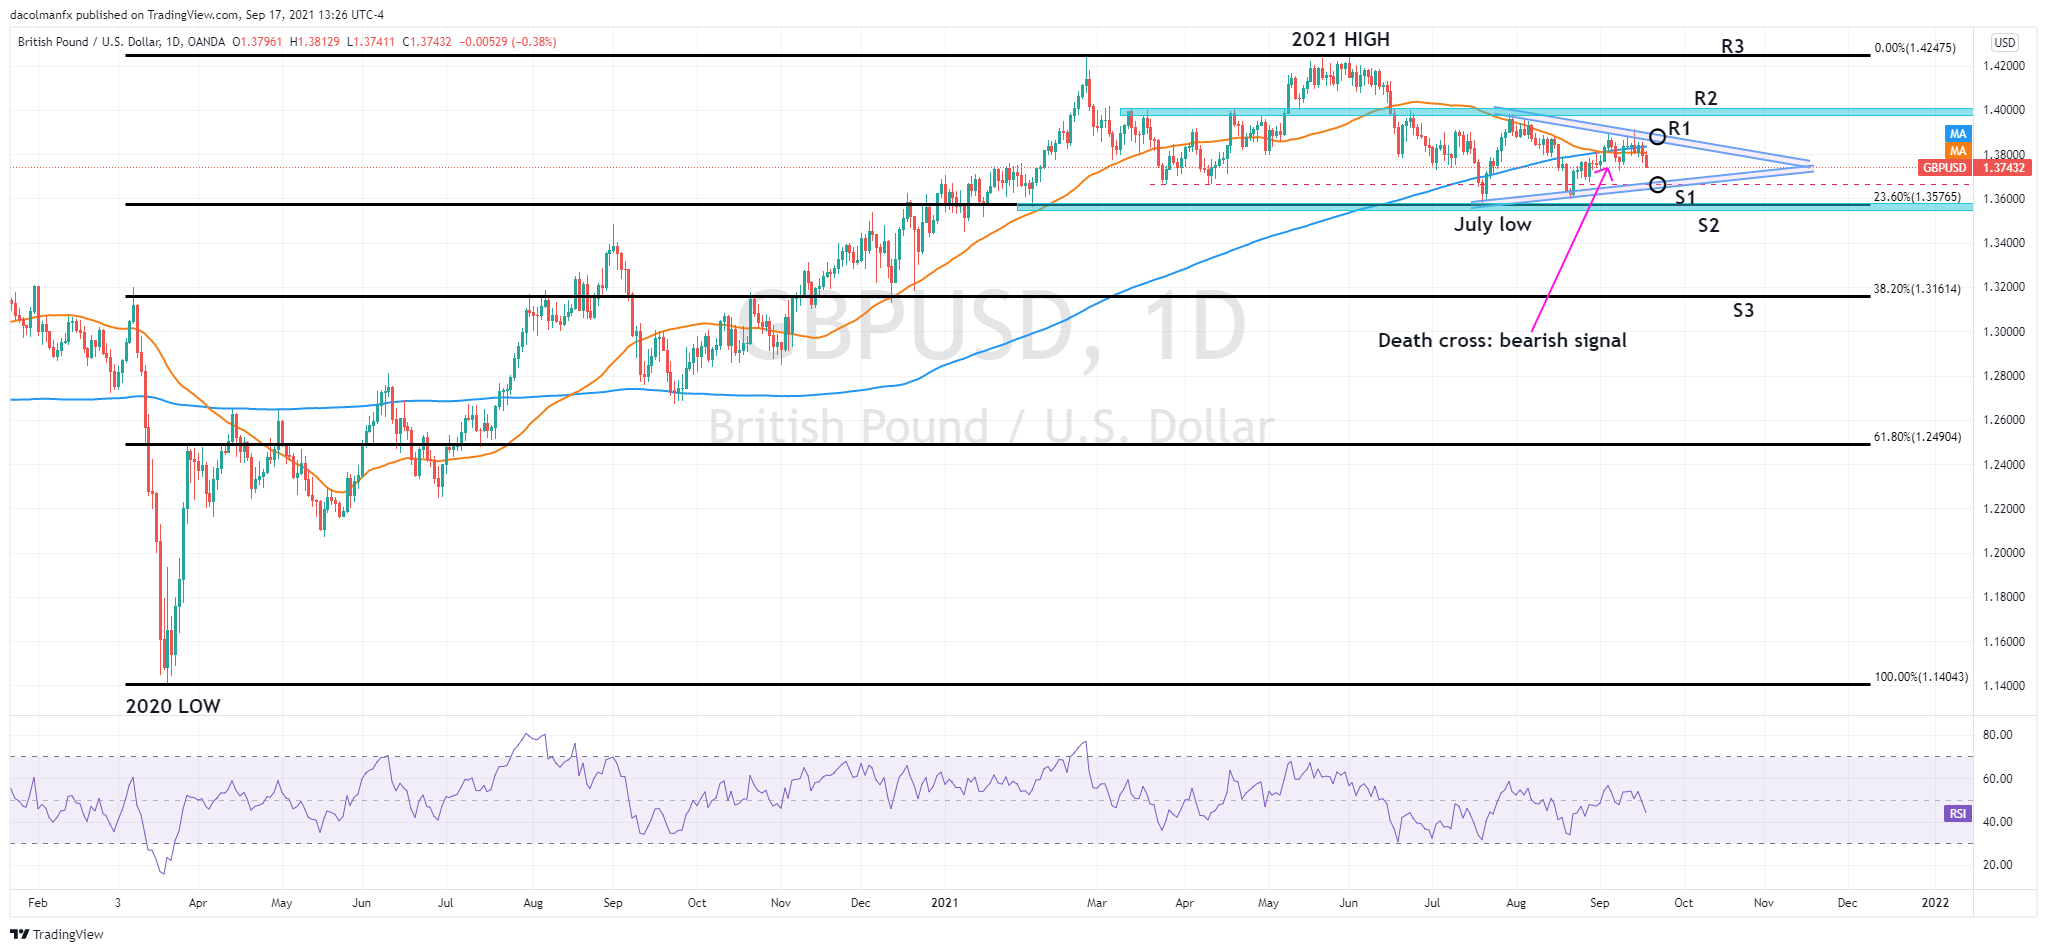
Coming back to GBP/USD, it is unlikely that the pair will make a major directional move until it exits the consolidation mode. For that to happen, price would have to break out of the symmetrical trianglediscussed earlier. With that in mind, key resistance currently stands at 1.3885, while support can be seen near 1.3670.
If GBP/USD pivots to the upside and climbs above 1.3885, there would be room for a move towards 1.4000 and possibly 1.4247. On the other hand, if the pair comes under further selling pressure and manages to pierce the 1.3670 floor, bears could target the July low in the 1.3572 region before the end of September.
From a technical analysis standpoint, current market consolidation could resolve to the downside, especially after the flare-up of a death cross at the outset of the month. The death cross, by definition a bearish signal, occurs when the 50-day SMA trends lower and crosses the 200-day SMA from top to bottom.That said, it would not be surprising to see GBP/USD weakness in the coming week.
| Change in | Longs | Shorts | OI |
| Daily | -5% | -15% | -10% |
| Weekly | -10% | 3% | -5% |
DAILY GBP/USD TECHNICAL CHART
EDUCATION TOOLS FOR TRADERS
- Are you just getting started? Download our beginners’ guide for FX traders
- Would you like to know more about your trading personality? Take our quiz and find out
- IG's client positioning data provides valuable information on market sentiment. Get your free guide on how to use this powerful trading indicator here.
- Subscribe to the DailyFX Newsletter for weekly market updates and insightful analysis
---Written by Diego Colman, DailyFX Market Strategist


