


GBP/USD Technical Highlights:
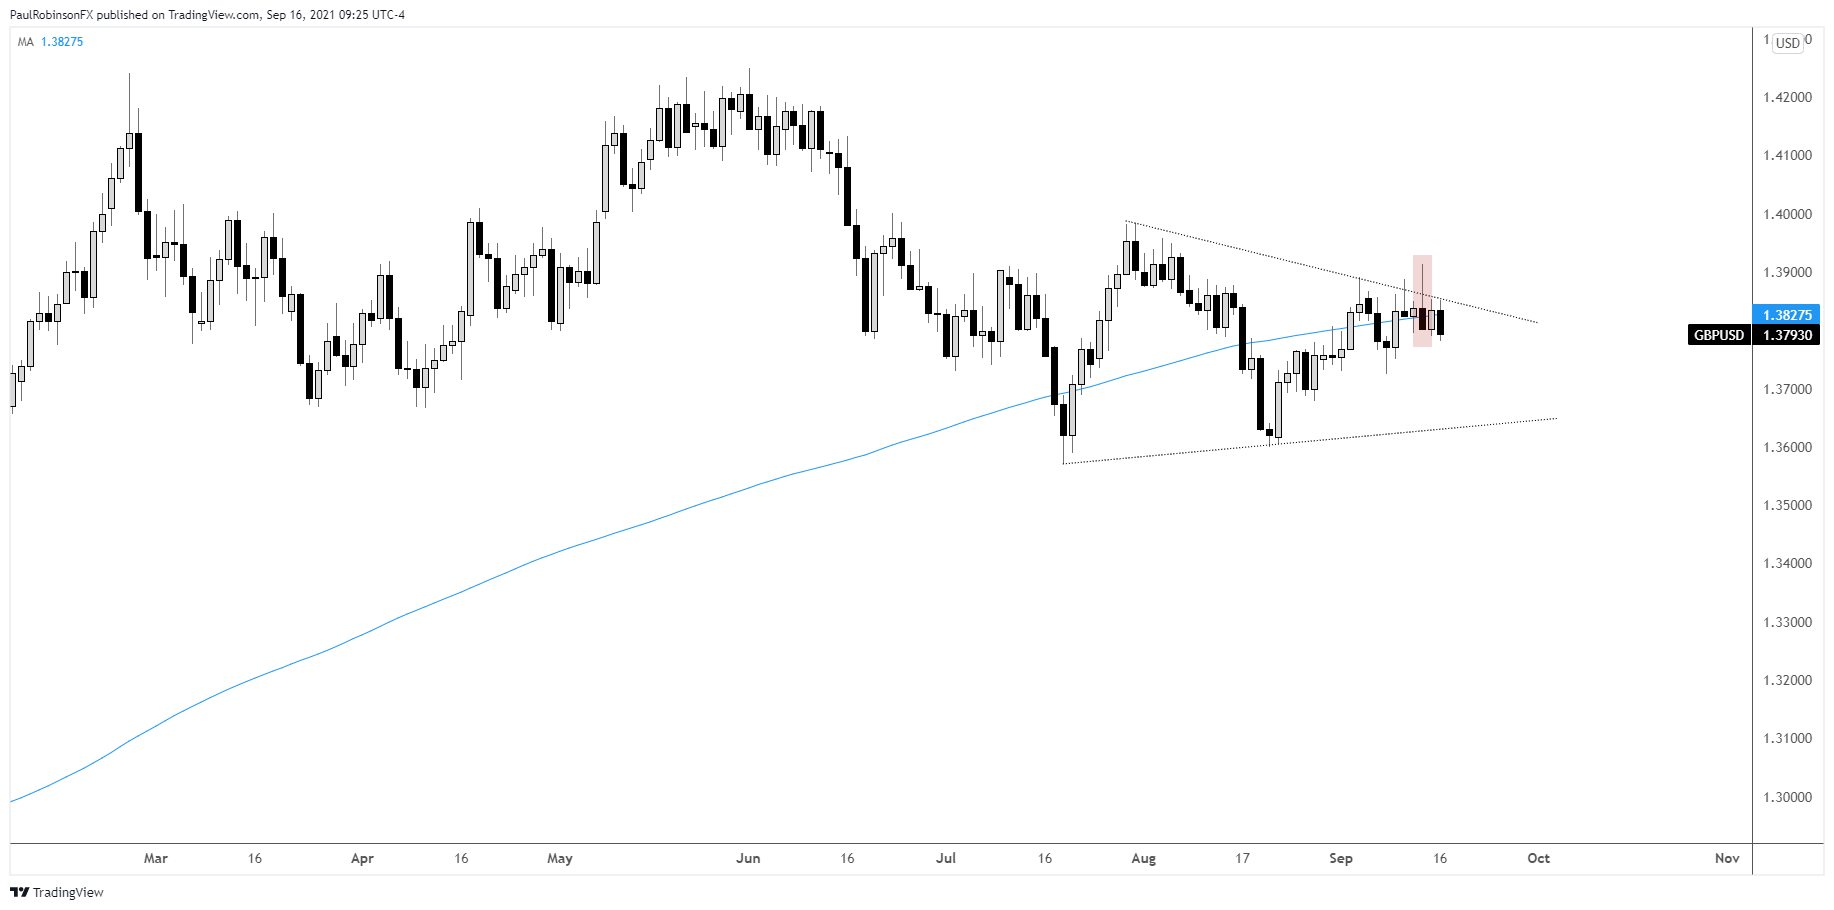
- GBP/USD daily chart shows powerful rejection creating bearish tone
- The 4-hr chart has cable breaking its short-term uptrend
Cable posted a powerful rejection earlier this week, and it came on an attempt to get out of a sticky area around the 200-day moving average. Dialing in a little closer, the 4-hr chart shows the near-term trend structure breaking.
The combination of a powerful rejection and breaking of trend support suggests we will see GBP/USD fall from here. What would tap the brakes on this notion, is if we see a rally past 13853, the high over the past couple of days, as this would have price clearly back inside the channel it is currently breaking down out of.
For the full details, check out the video above.
GBP/USD Daily Chart
GBP/USD 4-hr Chart

Resources for Forex Traders
Whether you are a new or experienced trader, we have several resources available to help you; indicator for tracking trader sentiment, quarterly trading forecasts, analytical and educational webinars held daily, trading guides to help you improve trading performance, and one specifically for those who are new to forex.
---Written by Paul Robinson, Market Analyst
You can follow Paul on Twitter at @PaulRobinsonFX


