


Gold Technical Forecast: Neutral
- Gold bears were on the prowl again after a really strong Non-farm Payrolls report.
- Prices are holding at a big spot of support but a failed breakout at a key spot has Gold prices taking on a more bearish tone.
- The analysis contained in article relies on price action and chart formations. To learn more about price action or chart patterns, check out our DailyFX Education section.

Gold bulls just cannot catch a break. After the metal hit a fresh all-time-high a year ago, there’s been numerous fits and starts of possible resumption in that bullish trend. But, to date, most have fallen flat and many have turned into downright reversals and, at this point, Gold prices remain about 15% away from that all-time-high that was set a year ago, on August 7th.
That was a Friday and Gold put in a bearish engulfing pattern on the daily chart. At the time, it seemed as though this would lead to a pullback but, here we are a year later and that all-time-high remains untested and buyers continue to get the rug pulled out from underneath them.
After that high was set and as prices began to pull back, a bearish channel formed, giving the appearance of a bull flag formation. It appeared as though buyers were going to resume that bigger-picture trend in May as prices broke out from the channel, but those hopes were dashed in June when Gold put in a nasty move after the FOMC rate decision, accounting for the worst monthly performance in Gold since November of 2016. Of course in that prior instance, rates were hiked eight times over the next two years; and more recently, this happened as the Fed highlighted a more hawkish stance towards rate policy in 2023 and beyond.
Prices began to tick-higher in July, retracing 50% of that June sell-off and opening the door for bullish breakout potential, as I had looked at a couple of weeks ago. But buyers were unable to test above the key level, and prices in Gold eventually sunk back towards support before breaking down again today on the back of the July NFP report. That sell-off as continued with prices pushing back towards a key trendline.
To learn more about drawing trendlines, check out DailyFX Education
Gold Daily Price Chart

Chart prepared by James Stanley; Gold on Tradingview
There’s a bit more going on in this current zone of support, and this is an area on the chart that I’ve been following for some time. In March Gold prices built in a double bottom formation, often approached with the aim of bullish reversals. A key component of that formation is the ‘neckline,’ which is the price to follow to monitor the break, and the current zone of support is the same as the neckline from that double bottom from back in March.
On the topic of levels and similarly notable is where the July rally stalled and where the potential breakout had failed: This prints around the 50% marker of the June major move and the fact that prices could not take out that level highlights the fact that the selling pressure from the June theme may not yet be over.
The case isn’t yet clear as prices are holding above a key spot of support; but this may not last for long and if sellers are, in fact, able to push below the 1750 level, the 1680 swing low would then be exposed. And in the realms of drivers, one has to imagine that quite a bit would need to happen before the Fed gets more dovish; and if we go off of the comments from FOMC Vice Chair, Richard Clarida, it would seem that the bank is even closer to a less-dovish tweak to policy than what markets are expecting. This was illustrated again with the July NFP report, and puts even greater pressure on the offer of Gold prices.
The forecast for next week will be set to neutral but there is bearish potential here, and that can be confirmed next week if sellers are able to take out or test through this very key spot of short-term support.
Gold Daily Price Chart
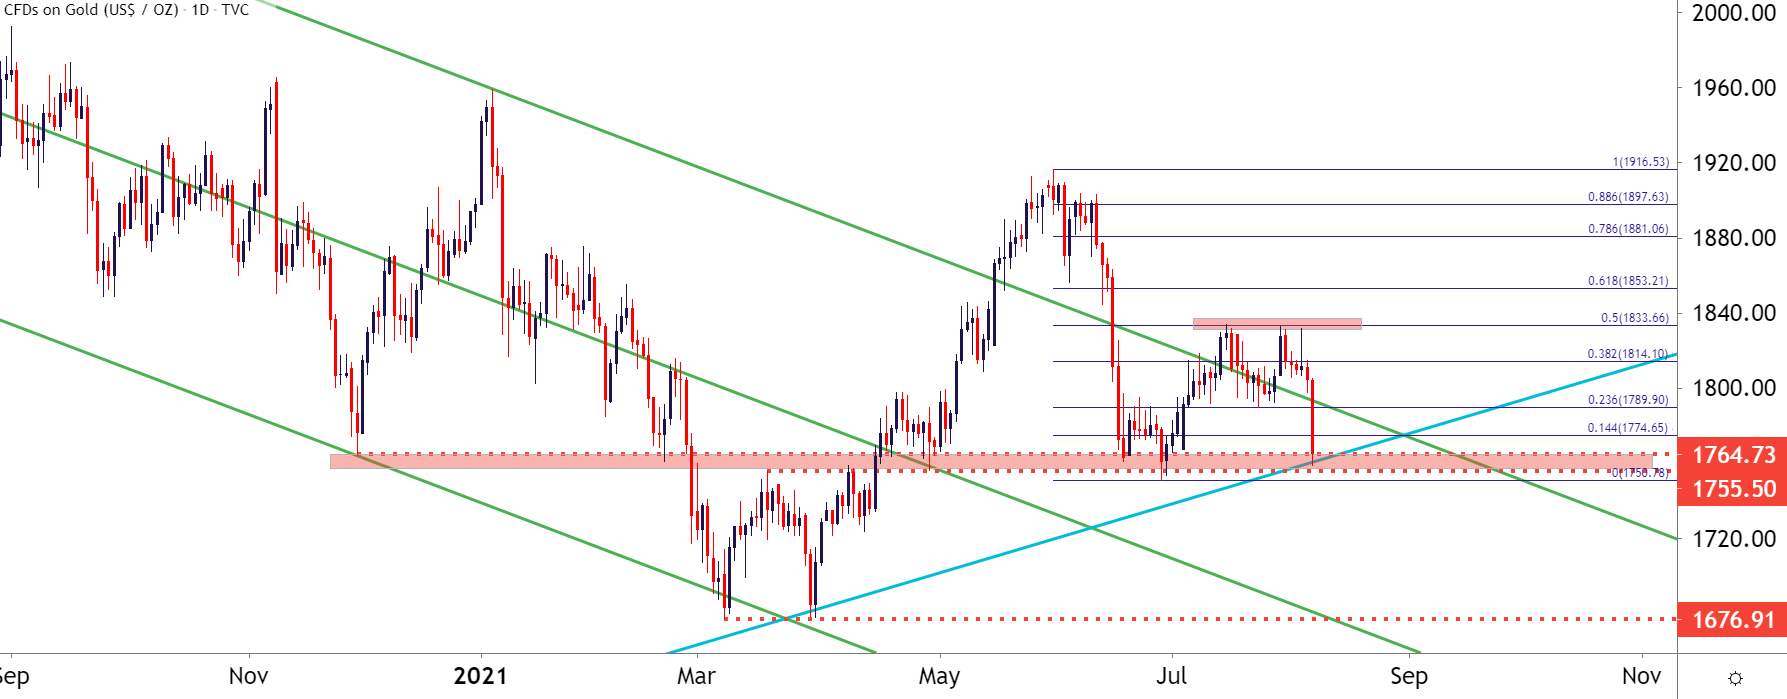
Chart prepared by James Stanley; Gold on Tradingview
--- Written by James Stanley, Senior Strategist for DailyFX.com
Contact and follow James on Twitter: @JStanleyFX


