


Crude Oil Technical Forecast Talking Points:
- Crude oil closed Friday in the red, breaking a run of six consecutive weeks’ advance
- The prevailing technical trend is still firmly bullish until there is a break below the 50-day moving average and trendline support stretching back to November at 68
- Volatility from this past week coincides with a general risk market shudder but the stall at 76 exerts technical weight in a long-term double top and Fib

Technical Forecast for Crude Oil: Bearish
What time frame you evaluate a market on can render a very different perspective on what bearing and tempo you register. Crude oil on a weekly or month chart looks like it is powered by a momentum-backed bull run. However, on the daily and lower periodicity charts, there is a more prominent sense of reluctance recently that bestows greater weight to an already impressive technical overhead at 76.00. Before considering the higher scale technical barriers, it is worth noting the pickup in volatility for the commodity this past week. The two-day drop after the failed attempt to break the aforementioned overhead extended a swell in the crude volatility index (OVX) by nearly 40 percent and pushed up the 5-day (1-week) average true range to its highest since May 24th. Volume also jumped during the selloff to levels not seen since mid-March. There is greater activity for the market in bearish legs generally, but it is a reminder of the market that can appear should a significant support give way.
Chart of WTI US Crude Oil Futures with Volume and 50-Day Moving Average (Daily)

Chart from TradingView
Notching the chart’s time frame up to the weekly periodicity, we can start to appreciate the relevance of the jump in volatility in context of the technical anchors. The 76 level that we are presently hesitating has established some unmistakable technical weight back in 2018 when a double top at the same level eventually led to a strong 7-straight week tumble and a bear leg that eventually saw a -45 percent loss of altitude. At present, this past week’s modest bearish close breaks a bullish streak of six straight weeks of advance, but it doesn’t project anything more than hesitation…for now. The doji on the weekly chart reflects the intra-week volatility and the draw of the 76 level. In contrast, to truly kill momentum, a break of 68 would be a critical bearish shift for the market which was a range resistance for more than two years and currently the trajectory of the 50-day moving average and trendline support.
Chart of WTI US Crude Oil Futures with Volume and 50-Week Moving Average (Weekly)
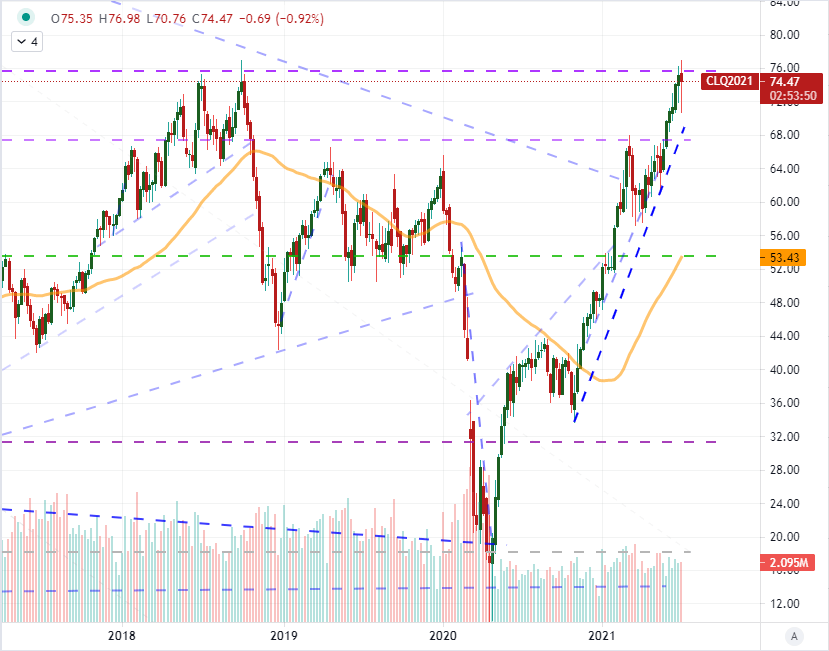
Chart from TradingView
Taking the chart all the way up to the monthly chart, the full scope of the 76 level comes into view. Beyond the range high stretching back over the past six years, it is also the 61.8 percent Fibonacci retracement of the 2008 record high to the 2020 absolute low (when the market went negative). There is considerable debate in technical circles as to whether the distortionary tail formed in April 2020 should be considered when extruding technical levels, but I believe the weight of such chart based analysis is bolstered by its recognition among market participants. It hard to miss that tail.
Chart of WTI US Crude Oil Futures with Volume and 50-Month Moving Average (Monthly)

Chart from TradingView
Charting some fundamentals into the picture, there are a few things that I think are important to watch over the coming week for guidance on crude. Don’t worry, it is just looking to the charts of other asset classes. First is the consideration of risk trends. Oil is generally connected to the strength of economic convictions, but it is also an asset heavily traded among market participants. As such, in the event of a strong downdraft in sentiment (‘risk aversion’), crude is more likely to decline in sympathy. That said, it would likely take a critical break from the likes of the S&P 500 to get oil below 68. Another chart to compare to over the coming week is the US 10-Year Treasury yield. This is a measure of interest rate expectations – which can influence oil – but it is also a reflection of economic expectations. Should the yield continue to slide below 1.30, it is likely that the demand forecast for this commodity will start to falter as well.
Chart of WTI US Crude Oil Futures with Volume and 50-Day Moving Average (Daily)

Chart from TradingView
Finally, a look at market activity behind the chart. Net speculative futures positioning is still heavily net long, but there has been little progress in building up that conviction over the past year. At just shy of 500,000 contracts net long, we have seen positioning hold within 50,000 contracts higher and lower of this level since shortly after the pandemic. In retail activity, we see the impact of a shorter trading time fame on display. There has been a lot of activity that aligns to swings within the advancing trend channel that suggests appetite for the well defined technical boundaries we have been dealing with these past months.
Chart of WTI Crude Oil Overlaid with the Spread Between US and UK Benchmarks (Daily)
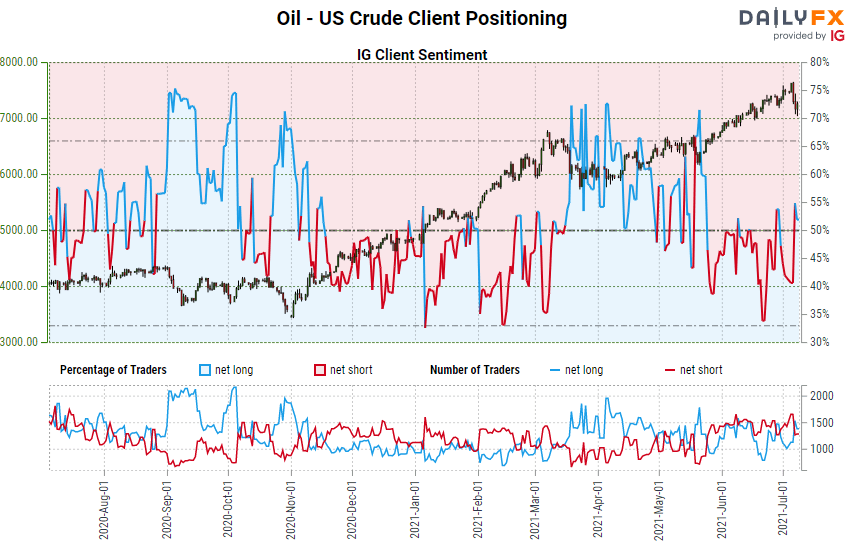
Chart from DailyFX.com with Data from IG


