


Gold Price Forecast: Neutral
- Gold prices showed a bit of stability this week after last week’s fast and heavy re-pricing.
- With the Fed highlighting an eventual end to pandemic policy, will Gold bulls be able to recover?
- For now, a rather consistent range had built-in this week and the case for mean reversion may stick around until we get closer to the Jackson Hole Economic Symposium in late-August.
Gold prices found a bit of stability this week after a rather tumultuous first few weeks of June trade. Coming into the month, optimism abound as prices traded around the 1900 level, holding after a bull flag breakout in the month of May. But what started as a pullback quickly turned into a bearish trend, and when the Fed spoke in the middle of June Gold prices plummeted down to fresh monthly lows.
But the sell-off stalled at a big spot on the chart, helped along by a couple of confluent Fibonacci levels and just above the prior neckline from the double bottom formation that had built in March. This led to a Monday bounce to kick off this week but sellers remained on the sidelines, and continued to offer Gold lower inside of the 1800 marker.
To learn more about Fibonacci, check out DailyFX Education
Gold Daily Price Chart

Chart prepared by James Stanley; Gold on Tradingview
Gold Near-Term: A Range Appears
After a riveting move last week Gold prices put in a relatively quiet outing this week, sticking within a range formation that I had looked at in the Thursday article on Gold. This range was at least partially defined by a Fibonacci retracement drawn around the April 29 – June 1 major move, with the 88.6% retracement from that study helping to set support as the 76.4% retracement helped to define resistance.

Gold Hourly Price Chart
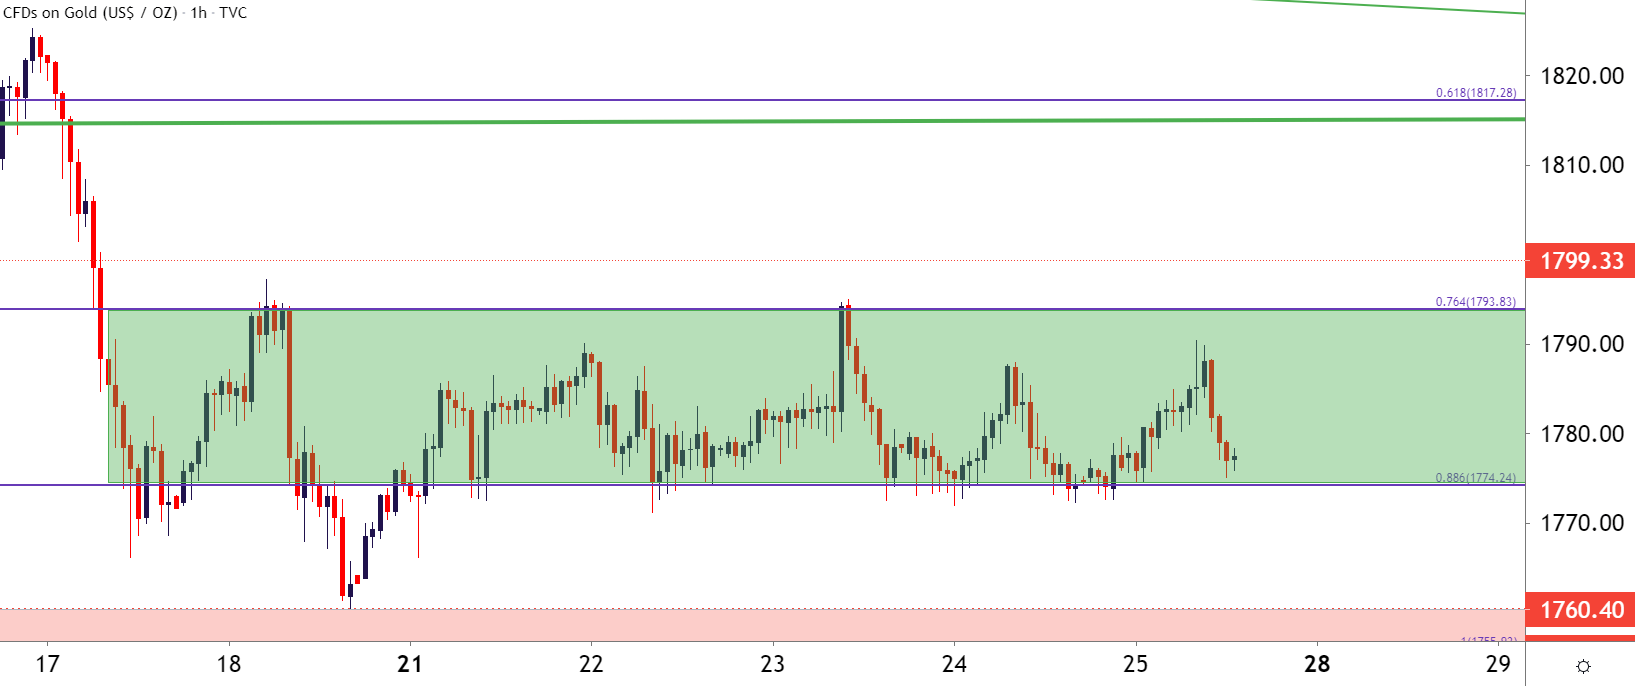
Chart prepared by James Stanley; Gold on Tradingview
Gold Price Forecast For Next Week: Neutral
At this point there’s a strong case on either side. For Gold bulls, technically, the argument can still be made that there’s existing technical structure to argue for bullish continuation. This would largely be taken from the longer-term backdrop, as seen on the weekly chart below. There’s both a bullish trendline and a 38.2% Fibonacci retracement from the 2018-2020 major move that could support such a thesis, but this would need some near-term agreement in the not-too-distant future given how aggressively sellers came in last week, before that door for bullish trends may reopen.

Gold Weekly Price Chart

Chart prepared by James Stanley; Gold on Tradingview
On the other side of that longer-term argument would be the premise that Gold prices sold off aggressively just from the simple hint that the FOMC may be getting closer to ‘less loose’ monetary policy. The Fed didn’t say that they were going to hike nor did they say that they were going to start planning for how they’d taper bond purchases. It was but one simple signal taken from the dot plot matrix that the bank may be looking to raise rates a little faster, and Gold prices plummeted and didn’t stop until a big spot of support came in to stall the move.
So the longer-term projection here is unclear as the main driver of that theme is similarly opaque, and that’s when the Fed may begin to go down that path of less loose monetary policy.
Judging by Gold’s price action, there appears to be little hope from market participants that this will be the case and that’s enough to at least offset the above synopsis of the longer-term theme. So, for now, the forecast will be held to neutral with focus shifted towards shorter-term ranges.
--- Written by James Stanley, Senior Strategist for DailyFX.com
Contact and follow James on Twitter: @JStanleyFX


