


Canadian Dollar Technical Forecast - Talking Points
- USD/CAD may have more upside before resuming broader trend lower
- AUD/CAD’s countertrend may continue before finding resistance at SMAs

USD/CAD Technical Forecast: Slightly Bullish
The Canadian Dollar weakened against the Greenback, marking USD/CAD’s first weekly gain since February as sinking energy prices dented the Loonie’s strength. Given that the drop in crude oil prices is likely to be a transitory event as the global economy continues ramping up, there is likely to be a resumption of the broader trend lower in USD/CAD.
That said, price action has been contained within a descending channel since late January, one that is part of a larger downward move rooted in the early 2020 Covid-induced USD rush. Prices may continue to climb to the channel’s upper bound given that the MACD oscillator crossed above its centerline late Friday.
To the downside, the 23.6% Fibonacci retracement level from the January to March move may offer support. Below that leaves open space for price to descend to the channel’s lower limit. Above, USD/CAD will aim for the 38.2% Fib level and the 20-day Simple Moving Average. Breaching above those levels would then likely see a test of the channel’s upper limit.
USD/CAD Daily Chart

Chart created with TradingView

AUD/CAD Technical Forecast: Slightly Bearish
AUD/CAD was nearly unchanged last week, with the risk-sensitive Australian Dollar finding support as oil prices declined towards the second half of the week. The pair’s 200-day Simple Moving Average, along with an area of price inflection from late last year, offered a layer of technical support. Given that prices have continued to decline since breaking below an ascending trendline earlier this month, the current downside move may persist.
The 200-day SMA, a high-visibility technical level, which has also appeared to offer a layer of support last week, is positioned to step in again should prices shift lower. To the upside, AUD/CAD faces the 61.8% and 78.6% Fibonacci retracement levels before the 20- and 100-day SMAs, which are both trending lower after completing a bearish cross.
AUD/CAD 6-Hour Chart
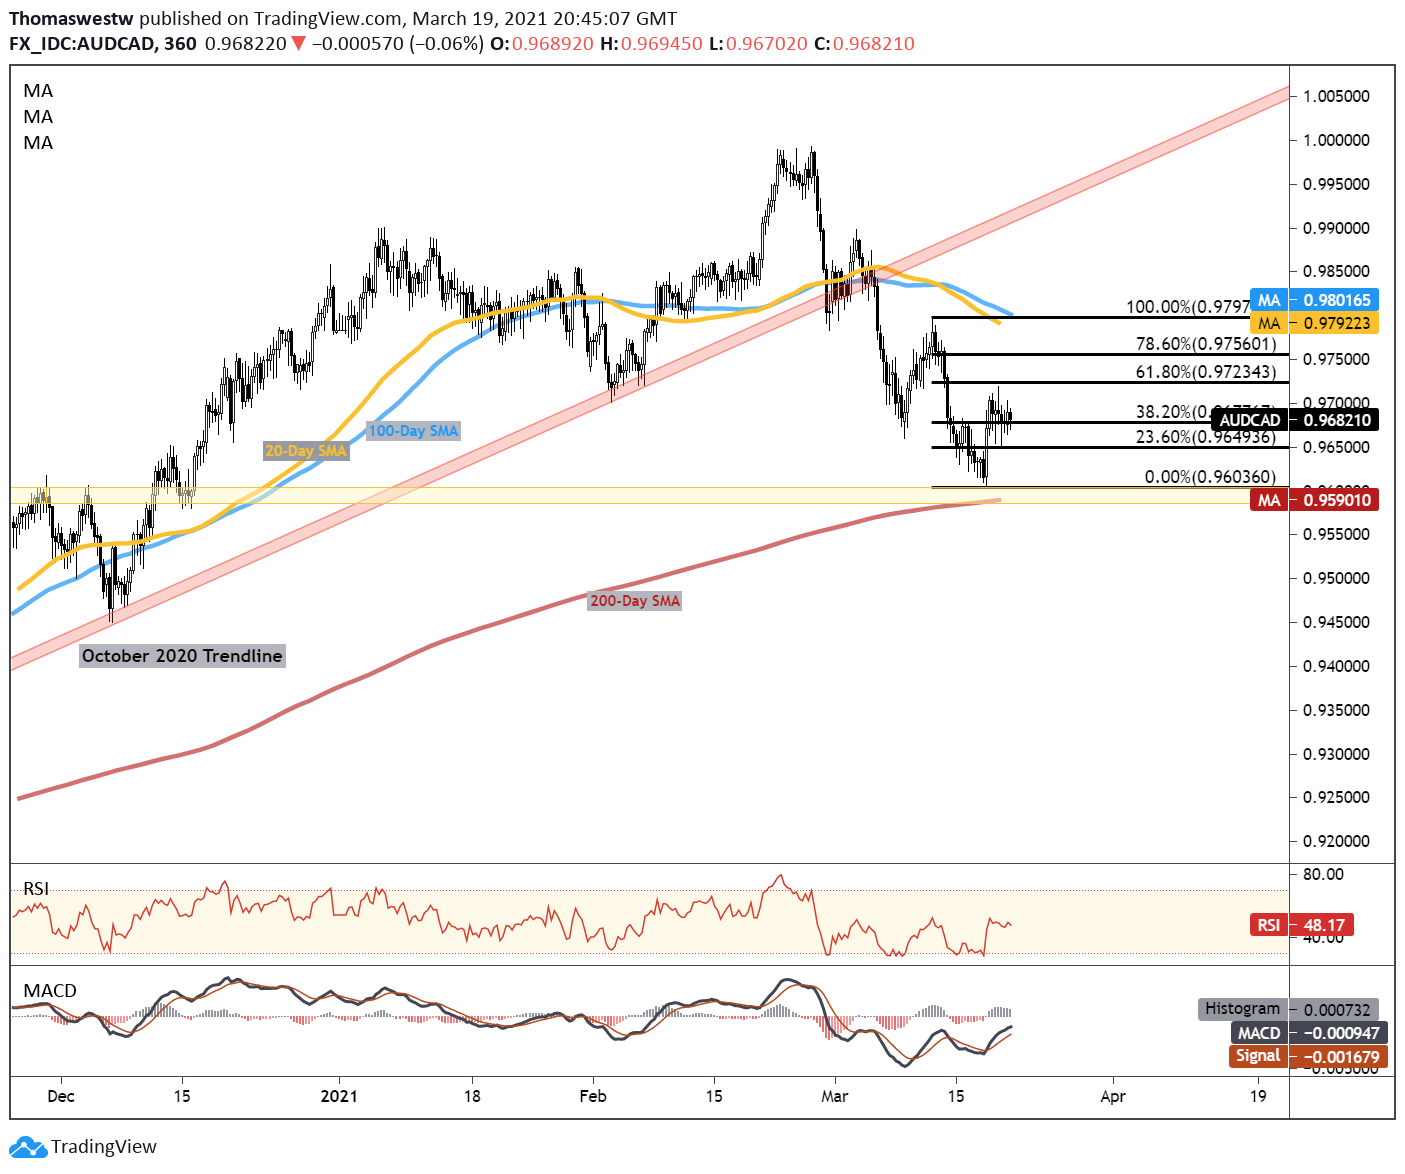
Chart created with TradingView
USD/CAD, AUD/CAD TRADING RESOURCES
- Just getting started? See our beginners’ guide for FX traders
- What is your trading personality? Take our quiz to find out
- Join a free webinar and have your trading questions answered
--- Written by Thomas Westwater, Analyst for DailyFX.com
To contact Thomas, use the comments section below or @FxWestwater on Twitter


