


Crude Oil, Stocks, Gold, XAU/USD, Fed, Treasuries, Commodities Briefing - Talking Points:
- Crude oil prices experience worst day since around April 2020 lows
- Europe demand woes and rising US Dollar sank WTI & gold prices
- WTI could bounce off key support, XAU/USD trades in Falling Wedge

A drop of 7.62% marked the worst single-day slump in WTI crude oil prices since volatility experienced around 2020 lows back in April. Then, the coronavirus, lockdowns and a price war destroyed demand for the commodity. Still, it is up over 15% from the start of the year. Energy prices faltered as concerns about vaccine rollouts in Europe and the reintroduction of lockdowns in parts of France amplified market fears.
Furthermore, a strengthening US Dollar did not make the environment easier for crude oil, and also anti-fiat gold prices. The Dow Jones, S&P 500 and especially tech-heavy Nasdaq Composite fell in the aftermath of Wednesday’s Federal Reserve rate decision. Chair Jerome Powell continued to remain calm about rising longer-term Treasury yields, opening the door to a resumption of portfolio reallocations across the board.
WTI can be quite sensitive to risk trends as it follows global growth prospects, so stock market volatility worked to amplify downside pressure on oil as energy stocks faltered. XAU/USD continued to be battered as the 10-year Treasury yield climbed 4.41% to 1.71%, fast approaching peaks last seen towards the end of 2019. The non-yielding precious metal becomes increasingly less competitive in this environment.
Heading into the remaining 24 hours, the economic calendar docket is fairly quiet as the weekend nears. As such, the markets may see some consolidation. Futures tracking Wall Street are little changed as the 10-year Treasury rate sees upside momentum fade. With that in mind, how are crude oil and gold prices positioning themselves ahead of next week?

Crude Oil Technical Analysis
WTI pierced below a rising trendline from October with swift momentum – see chart below. Having said that, the 50-day Simple Moving Average (SMA) and the 57.42 – 59.27 support zone stepped in to tame downside progress. Breaching these technical highlights may open the door to a deeper reversal in energy prices. But at the same time, this could be a turning point to perhaps revisit peaks from 2019 and 2020.
WTI Crude Oil Daily Chart
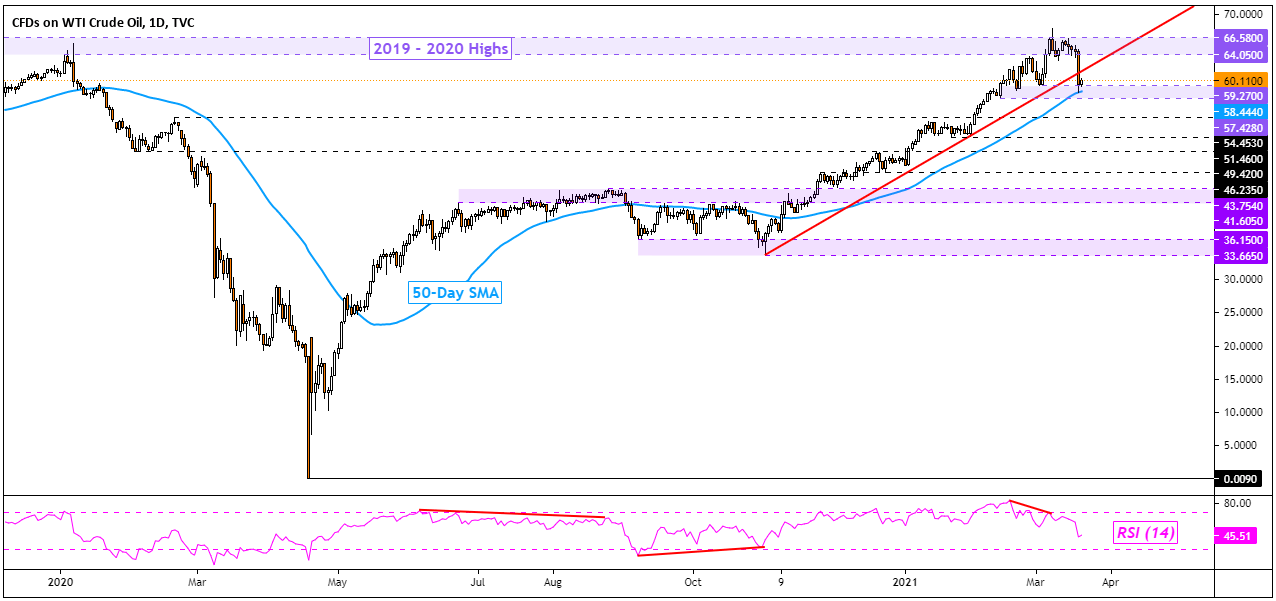
Chart Created Using TradingView
Gold Technical Analysis
Gold prices turned lower after testing the ceiling of a bullish Falling Wedge chart pattern. If XAU/USD continues to trade within the confines of this technical pattern, we may see the precious metal aim back towards the 1658 – 1678 support zone for another chance to bounce back up. Otherwise, breaching the range may open the door to deeper losses. Pushing above the wedge exposes the 50-day SMA.

Gold Daily Chart
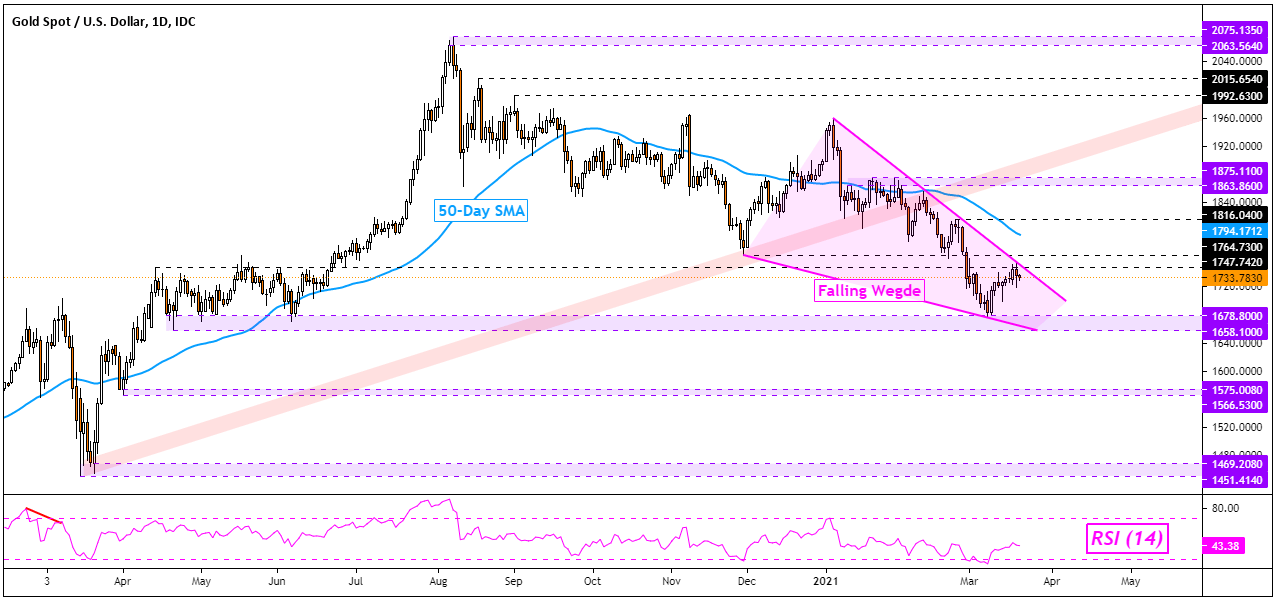
Chart Created Using TradingView
--- Written by Daniel Dubrovsky, Strategist for DailyFX.com
To contact Daniel, use the comments section below or @ddubrovskyFX on Twitter


