


British Pound (GBP) Price Outlook – GBP/USD and EUR/GBP
- GBP/USD continues to forge ahead after 1.4000 taken out.
- EUR/GBP sell-off continues and looks to have legs

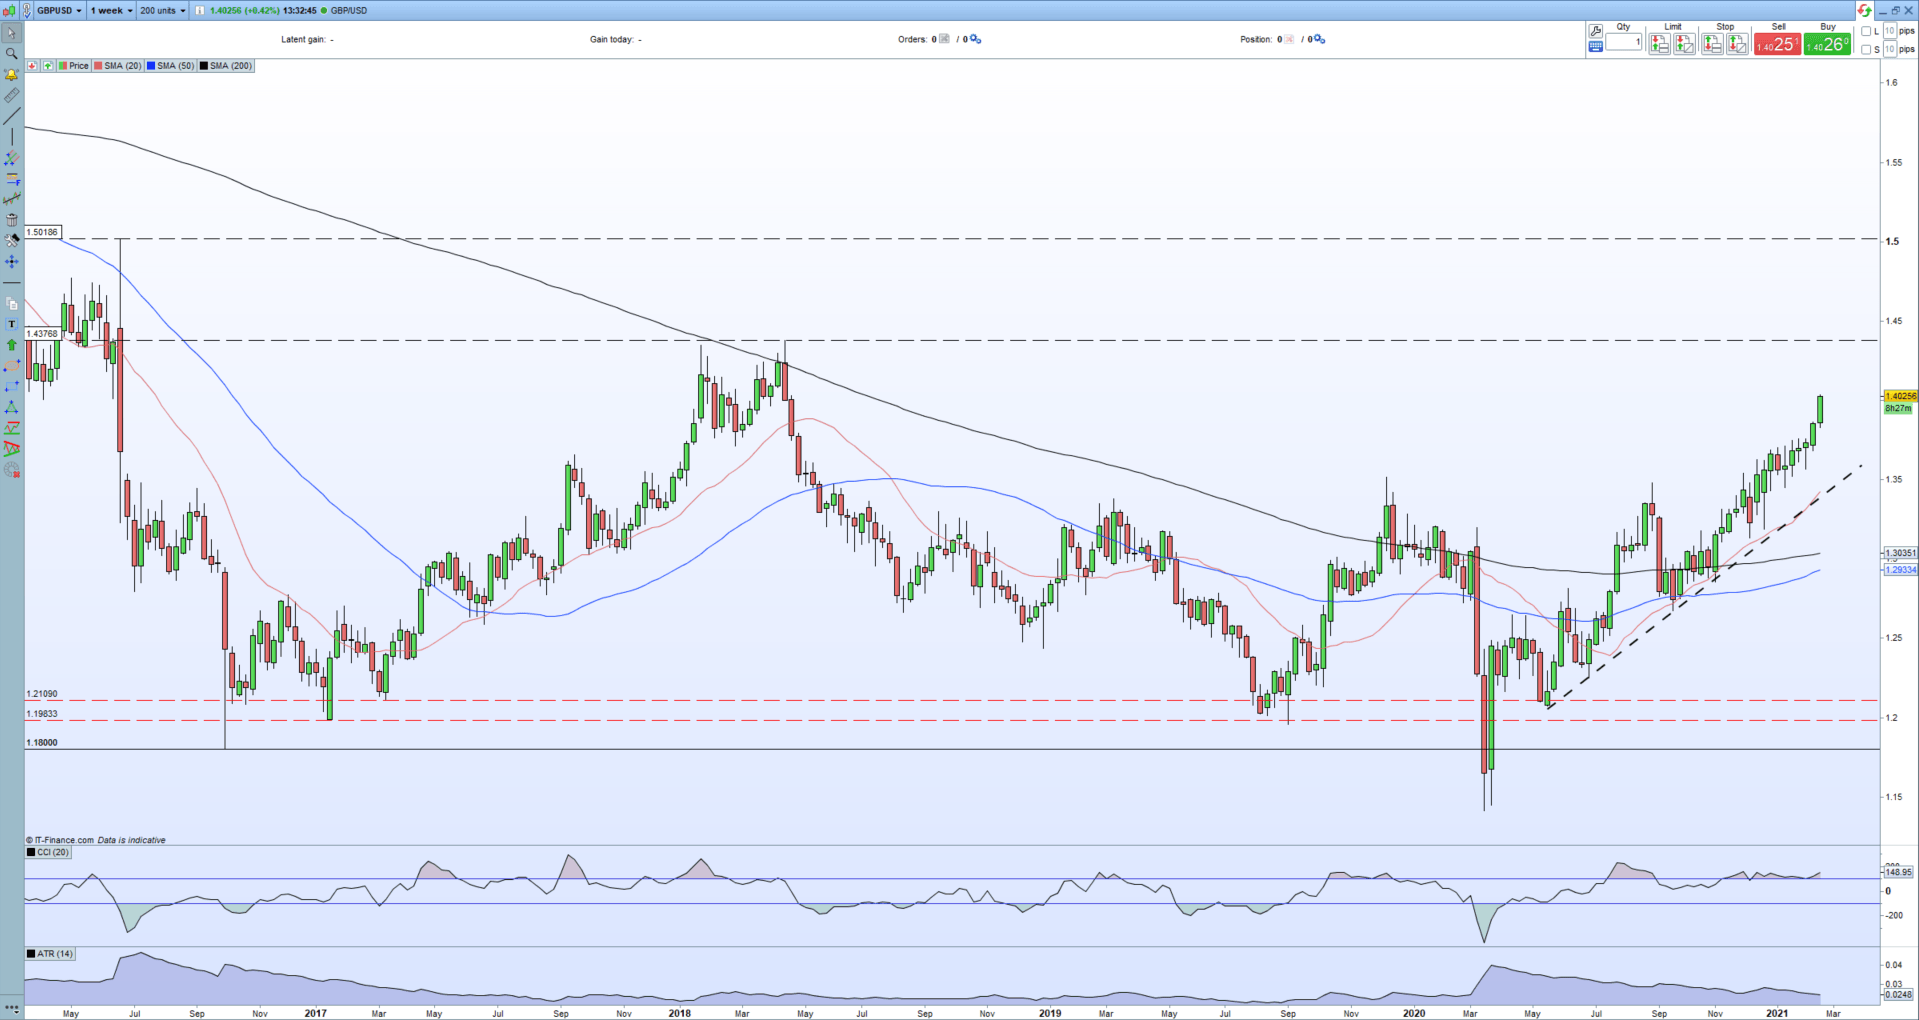
At the risk of sounding like a broken record, GBP/USD continues to edge higher with 14 of the last 16 weekly candles positive. The pair are now at their highest level since mid-April 2018 with little in the way of resistance before that month’s high print of 1.4377. The weekly chart also shows the 50-sdma (blue) nearing the 200-sdma (black) with a potential ‘golden-cross’ being formed in the next few weeks. While this may be late to the party, it could signify that the 1.4377 level is not the peak of this rally and a complete retrace of the Brexit move – high print at 1.5019 – may be on the cards. While small retraces may occur, this is not a move to get in the way of, instead, better to go with the flow.
Technical vs Fundamental Analysis in Foreign Exchange
GBP/USD Weekly Price Chart (June 2016 – February 19, 2021)
| Change in | Longs | Shorts | OI |
| Daily | 3% | -7% | -3% |
| Weekly | 4% | -10% | -5% |
Retail trader data show 31.80% of traders are net-long with the ratio of traders short to long at 2.14 to 1. We typically take a contrarian view to crowd sentiment, and the fact traders are net-short suggests GBP/USD prices may continue to rise.Traders are further net-short than yesterday and last week, and the combination of current sentiment and recent changes gives us a stronger GBP/USD-bullish contrarian trading bias.
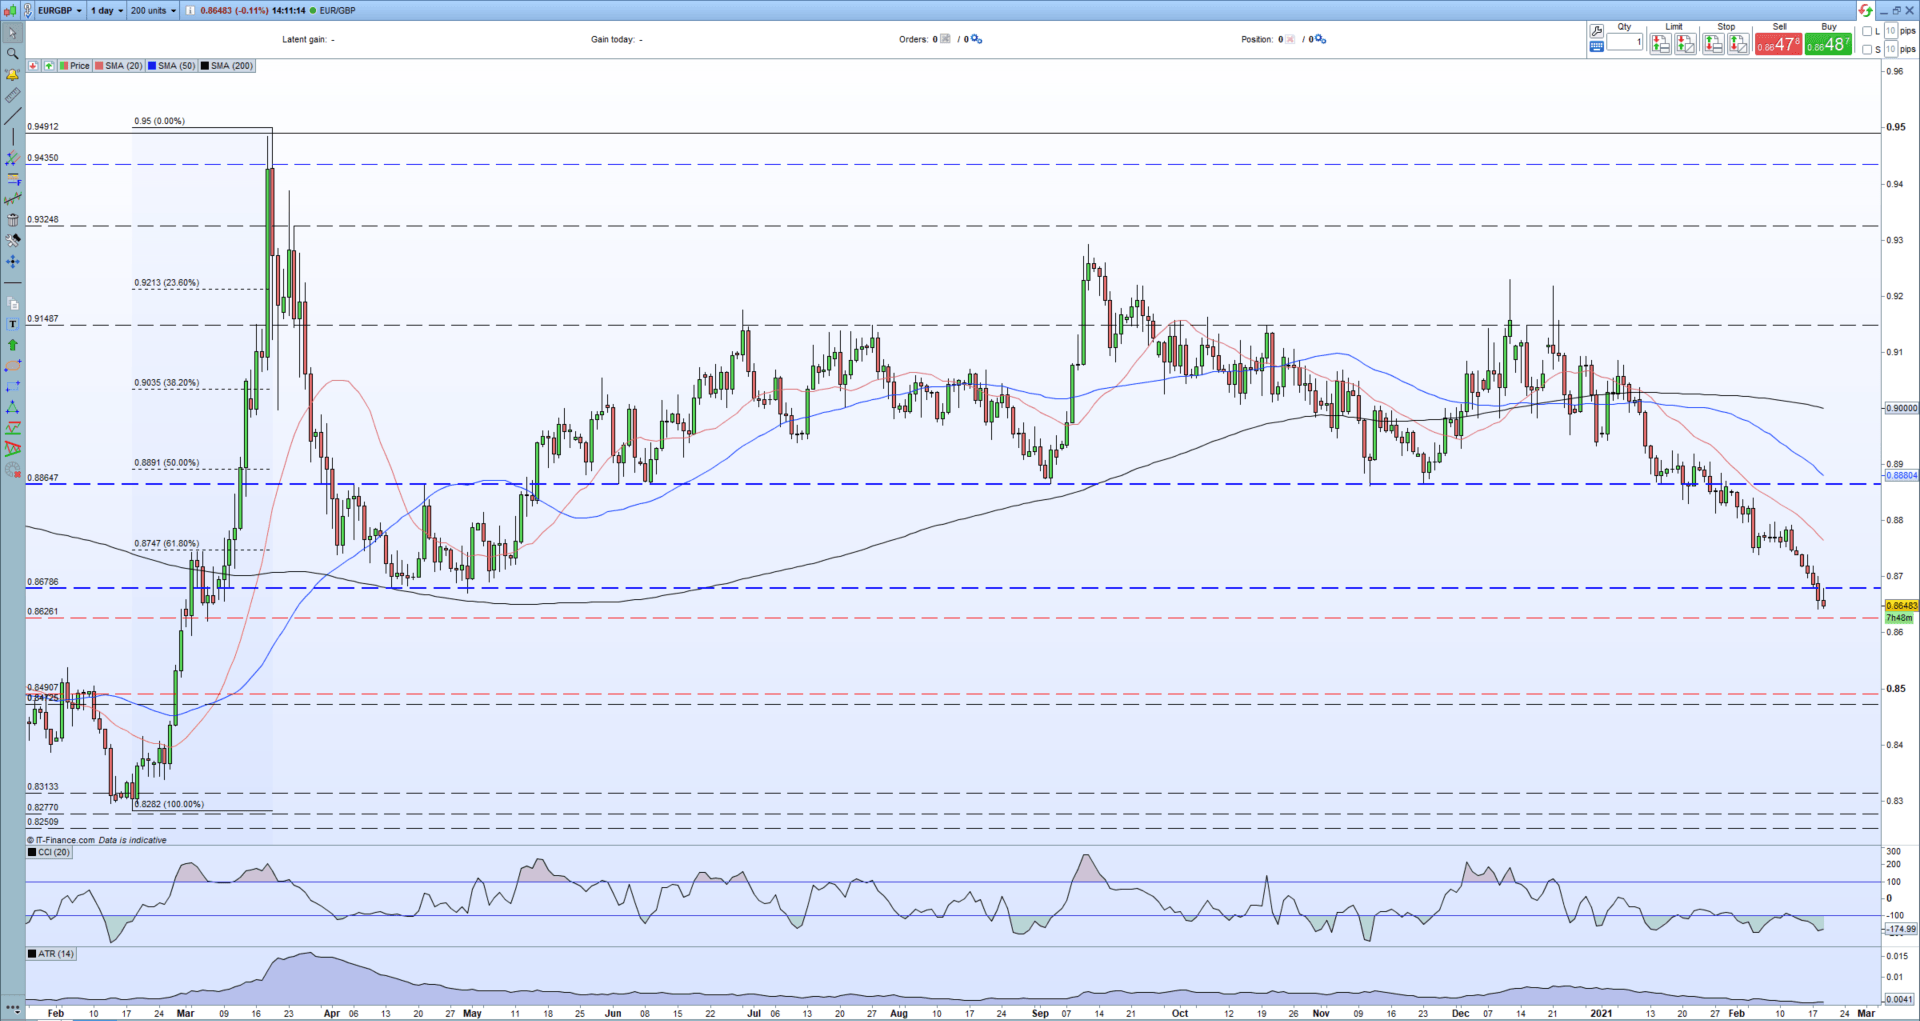
A sorry looking chart for EUR/GBP bulls with this week’s sell-off in particular breaking below some important levels. The first to go was the 61.8% Fibonacci retracement at 0.8747 before a cluster of old lows around 0.8670 to 0.8680. With these levels seemingly in the rear mirror, a full retrace back to the February 19, 2020 low print at 0.8282 is the likely longer-term objective. The chart does look oversold, using the CCI reading, and the Euro is also picking up a small bid so the next week may see a limited move. As long as the pair stays below the 0.8750 level, then the move lower will remain intact.
EUR/GBP Daily Price Chart (February 2020 - February 19, 2021)
Traders of all levels and abilities will find something to help them make more informed decisions in the new and improved DailyFX Trading Education Centre
What is your view on Sterling – bullish or bearish?? You can let us know via the form at the end of this piece or you can contact the author via Twitter @nickcawley1.


