


Gold, Silver Forecast for Next Week: Bullish
- Last summer Gold prices went into an aggressive bullish breakout, eventually setting a fresh all-time-high in early-August.
- Since then, however, Gold bulls have been on their back feet as prices have spent most of the past six months in varying forms of digestion.
- More recently, Silver prices have been getting the attention from metals bulls, along with the reddit crowd which has helped to prod the bid throughout this week.
When investors look to hedge against governments or monetary policy or even just the prospect of fiat debasement, they’ve long looked to the most precious of precious metals to hold as a store of value. I’m of course talking about Gold, and its role in economics spans back for pretty much as long as we’ve followed economics. This helps to explain Gold price action from last summer, when prices were flying higher in response to the Fed’s actions devised to offset slowdowns from the coronavirus pandemic. Gold prices began to really surge in June and by August, prices had jumped up to a fresh all-time-high of $2,075. But that’s when the proverbial music stopped in the breakout; price action began to digest and here we are almost six months later and bulls still remain in wait.
Silver prices, however, have received a recent shot-in-the-arm, and with some help from the same Reddit crowd that roiled a number of equities this week put in a strong topside breakout up to a fresh 2021 high. I wrote about this on Thursday, highlighting the deeper breakout potential that remained in the matter, and that theme continued through Friday trade with Silver prices jumping up to test trendline resistance.
Silver Daily Price Chart
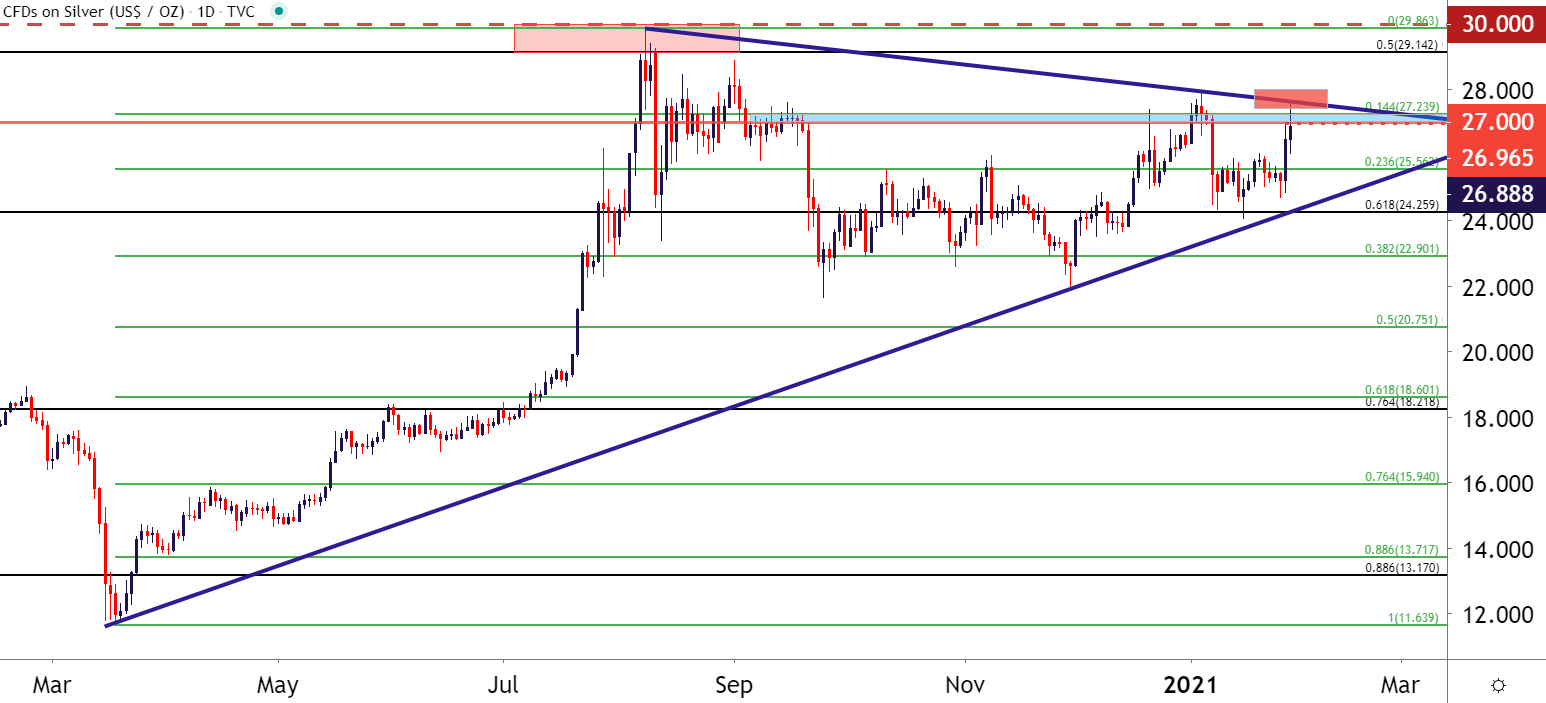
Chart prepared by James Stanley; Silver on Tradingview
Gold prices, meanwhile, have remained relatively subdued. There was a support test in the symmetrical triangle this week; but price action merely bumped back up to the same resistance zone that’s been in-play over the past two weeks.
There could be continued breakout potential in Gold: But that theme appears to lag behind that of silver, which we’ll look at deeper after the below chart.
To learn more about how symmetrical triangles can lead to breakouts, check out DailyFX Education
Gold Daily Price Chart: Still Coiling in the Triangle

Chart prepared by James Stanley; Gold on Tradingview
Gold/Silver Ratio Breaking Down
I had looked at this on Thursday to highlight how this shift between Gold and Silver bulls has been taking place. This is often expressed as the Gold/Silver ratio, which is simply the price of one ounce of Gold divided by the price of one ounce of Silver.
To learn more about the Gold/Silver ratio, this article can help
The Gold/Silver ratio had started to test the 70.00 level on Thursday. But, given that continued breakout in Silver as Gold prices remained pegged to resistance, even around FOMC, that dynamic continued to shift in Silver’s favor.
On Friday morning, the Gold/Silver ratio made a fast move towards the four-year-low around 67.75, further highlighting that greater strength exhibited in Silver prices.
Gold/Silver Ratio Monthly Chart

Chart prepared by James Stanley; Gold/Silver on Tradingview
Silver Strategy Moving Forward
At this point, with Silver exhibiting a stronger bid throughout the week with more of a response to recent market stress, traders may be more attracted to bullish themes than what’s currently showing in Gold.
The big item of interest on Silver for next week is the chart terrain stretching from 29.15 up to the 30.00 handle. This is where the current seven-year-high sits and came into play briefly last August. And while Gold prices quickly took out their prior all-time-high last year, Silver prices remained fairly far away from their own all-time-high which rests all the way up near the 50-handle.
So, if bulls can force a topside breakout beyond the 30-handle, there’s a considerable amount of open room on the chart. This keeps the forecast for Silver as bullish for next week.

Silver Monthly Price Chart
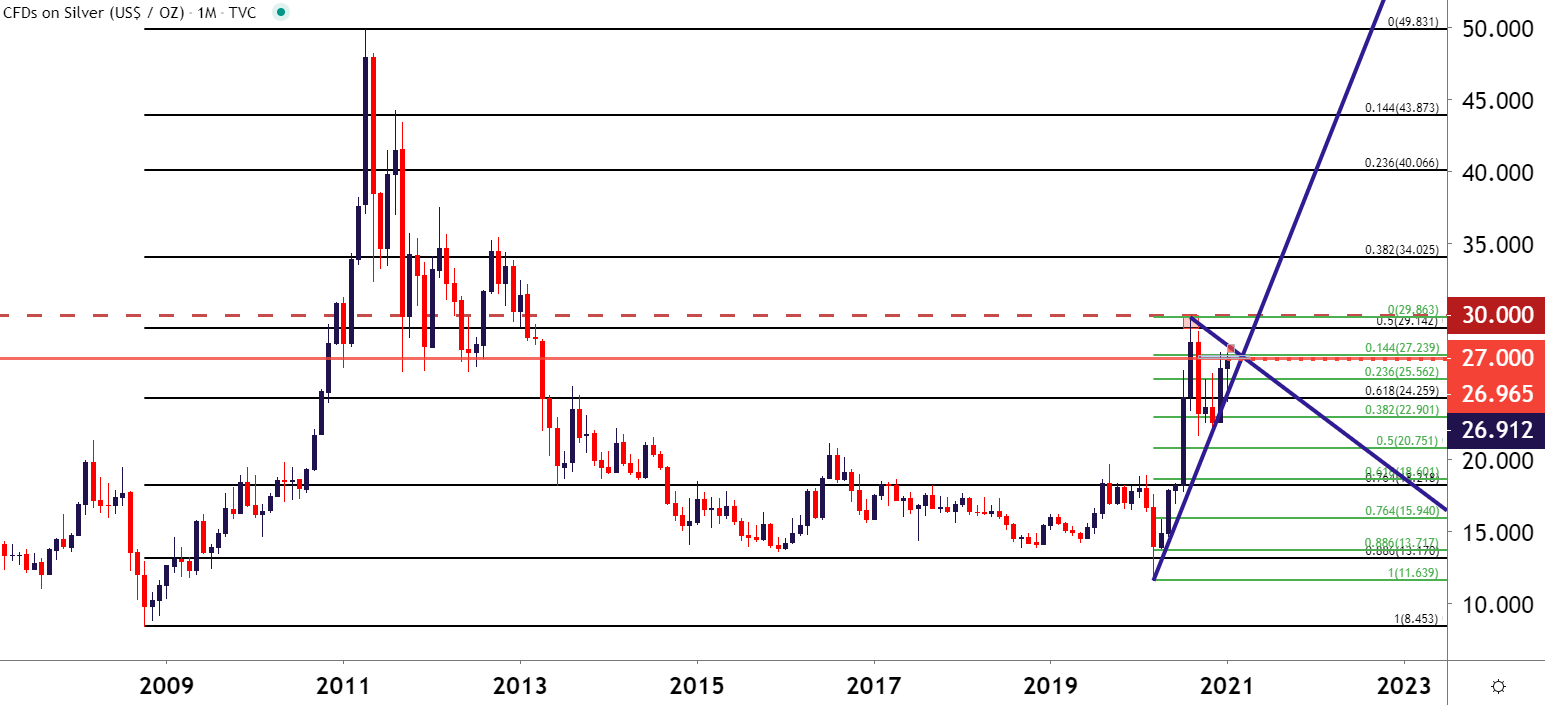
Chart prepared by James Stanley; Silver on Tradingview
Gold Strategy Moving Forward
Given the intense focus that remains on topics like stimulus or continued support from the Federal Reserve, there’s a fundamental case that remains on the long side of Gold prices. Price action as yet doesn’t quite reflect that, however, and traders should always be aware of this divergence when it does show.
The bull case here could be supported by the thesis that buyers are still grinding out of a longer-term bullish position. The longer-term symmetrical triangle does remain in order after another support test this week, and such formations can often lead to breakouts once that course of digestion does pass.
For Gold prices, the big area of resistance currently plots from 1859-1873. This was the same resistance zone that helped to hold the highs last week, before price action took another trip down to support at 1836.75. The next zone of resistance potential runs around 1900-1920, so Gold bulls may have their work cut out for them on the bullish breakout theme next week.

Gold Hourly Price Chart

Chart prepared by James Stanley; Gold on Tradingview
--- Written by James Stanley, Strategist for DailyFX.com
Contact and follow James on Twitter: @JStanleyFX


