


EURO WEEKLY TECHNICAL FORECAST: NEUTRAL
- Euro has faced considerable selling pressure since the start of the new year
- EUR/USD price action prints a close below its 50-day simple moving average
- EUR/AUD rebound potential is hinted at by bullish divergence on the MACD
- Learn more about the basics of technical analysis or popular chart patterns
The Euro has weakened broadly over the last few trading sessions. In fact, recent Euro selling pressure has steered EUR/USD, EUR/GBP, EUR/JPY, EUR/CAD and EUR/AUD into the red year-to-date. Relative downside across EUR price action this past week was seen particularly against the Pound as well as the Yen and US Dollar, which declined by -1.52%, -1.34% and -1.24% respectively. The Aussie was the laggard out of major Euro peers with EUR/AUD sliding by a more modest -0.55%.
EUR/USD PRICE CHART: DAILY TIME FRAME (21 AUG 2020 TO 15 JAN 2021)
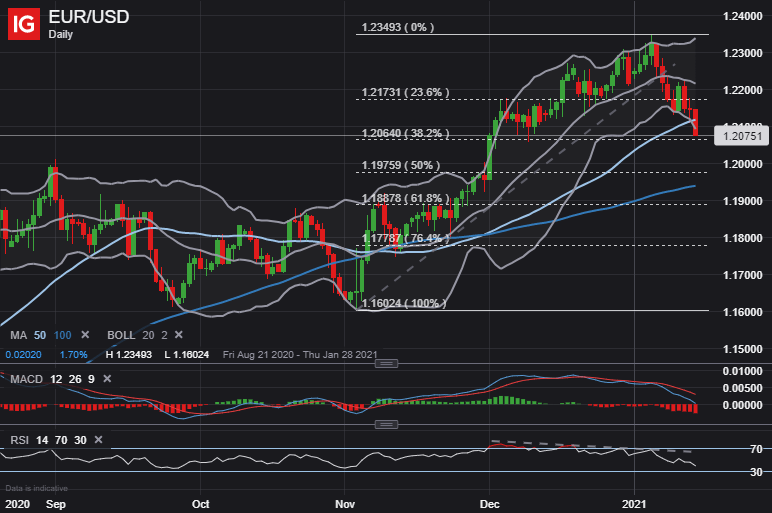
EUR/USD has pulled back sharply since rejecting the 1.2300-price level. The most liquid and heavily traded currency pair sank nearly 250-pips from its 06 January high, which propelled EUR/USD price action below its 50-day simple moving average. Not to mention, volatility and bearish momentum have accelerated recently judging by the MACD indicator and Bollinger Band expansion.
Confirmation of follow-through lower could be provided by a breakdown beneath the 09 December swing low and 38.2% Fibonacci retracement shown on the chart above. Taking out this possible zone of buoyancy might motivate Euro bears to make a deeper push toward the 100-day simple moving average. The negatively-sloped 20-day simple moving average may serve as a technical resistance level going forward if a relief bounce comes into play.

EUR/AUD PRICE CHART: DAILY TIME FRAME (24 SEP 2020 TO 15 JAN 2021)
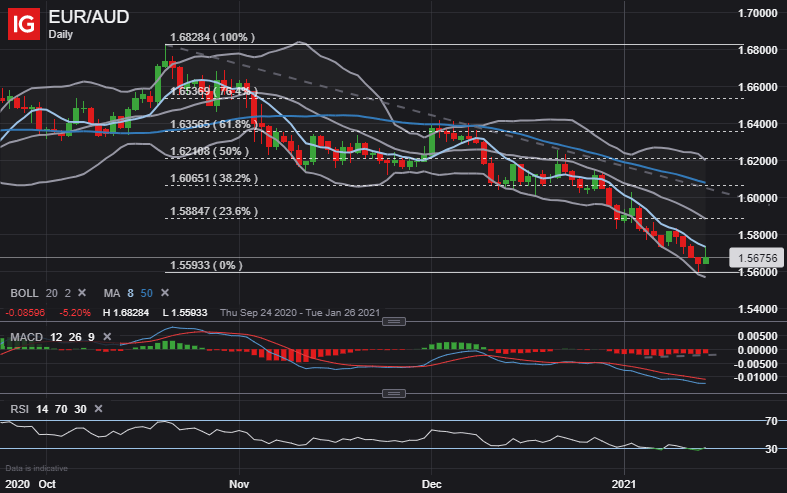
EUR/AUD price action is looking a little overextended as the Euro plunges to its weakest level against the Aussie since December 2018. The 8-day simple moving average underscores the FX pair’s short-term bearish trend. Surmounting this technical barrier, however, might open up the door to bigger rebound. In addition to positive divergence on the MACD indicator, waning EUR/AUD weakness is hinted at by the relative strength index perking back up out of ‘oversold’ territory.
Pinching Bollinger Band width also increases the statistical probability of a consolidation higher. If a rebound materializes, EUR/AUD bulls could look toward the 23.6% and 38.2% Fibonacci retracement levels as potential topside objectives. An upward move could fizzle out near broader bearish trend resistance connecting the October and December swing highs.

-- Written by Rich Dvorak, Analyst for DailyFX.com
Connect with @RichDvorakFX on Twitter for real-time market insight


